Italian vs Immigrants from the Azores Householder Income Under 25 years
COMPARE
Italian
Immigrants from the Azores
Householder Income Under 25 years
Householder Income Under 25 years Comparison
Italians
Immigrants from the Azores
$53,426
HOUSEHOLDER INCOME UNDER 25 YEARS
95.4/ 100
METRIC RATING
119th/ 347
METRIC RANK
$52,621
HOUSEHOLDER INCOME UNDER 25 YEARS
74.2/ 100
METRIC RATING
154th/ 347
METRIC RANK
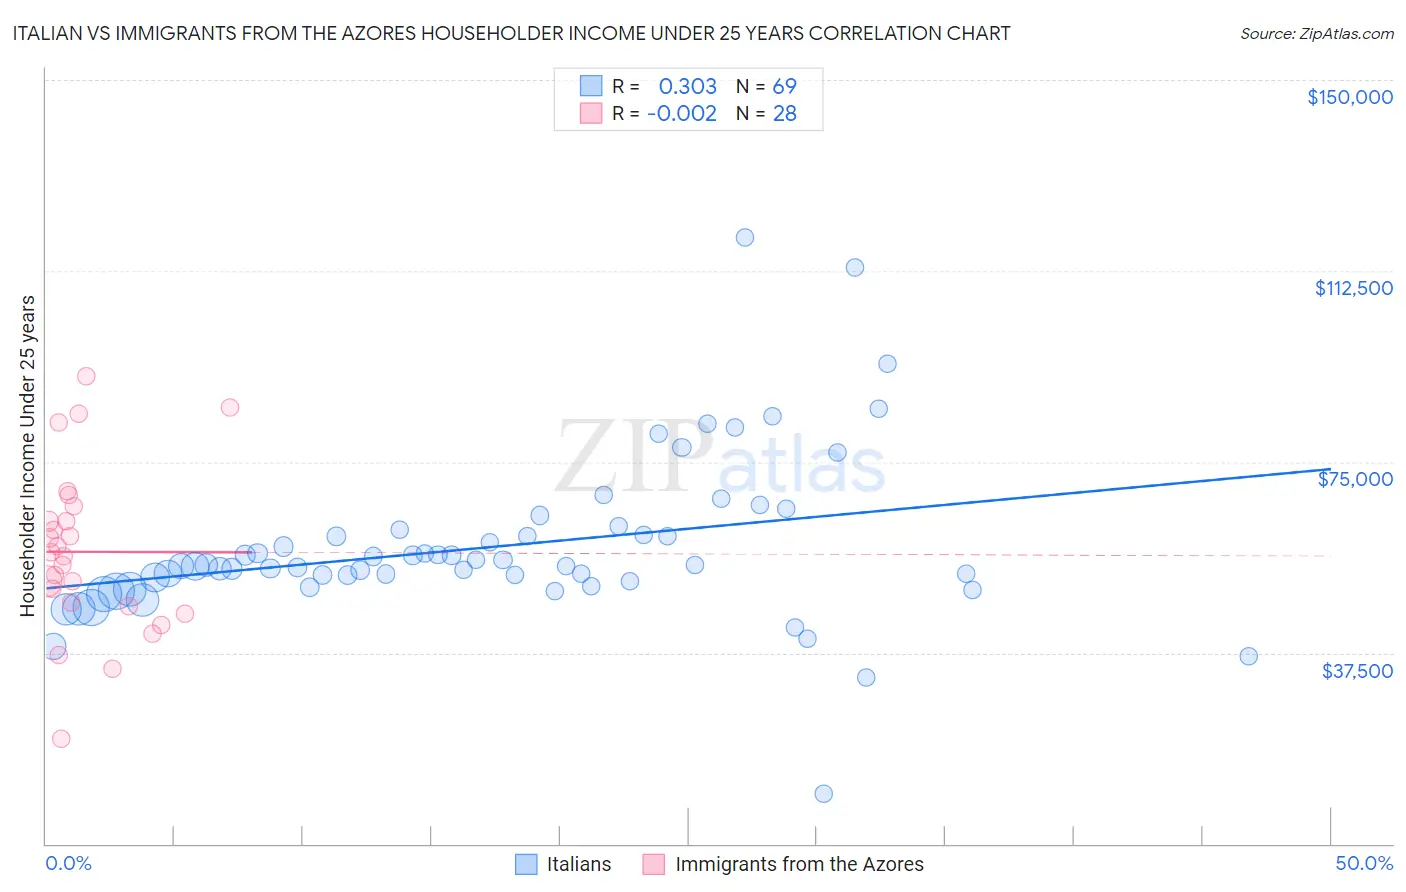
Italian vs Immigrants from the Azores Householder Income Under 25 years Correlation Chart
The statistical analysis conducted on geographies consisting of 440,319,823 people shows a mild positive correlation between the proportion of Italians and household income with householder under the age of 25 in the United States with a correlation coefficient (R) of 0.303 and weighted average of $53,426. Similarly, the statistical analysis conducted on geographies consisting of 40,962,746 people shows no correlation between the proportion of Immigrants from the Azores and household income with householder under the age of 25 in the United States with a correlation coefficient (R) of -0.002 and weighted average of $52,621, a difference of 1.5%.
Householder Income Under 25 years Correlation Summary
| Measurement | Italian | Immigrants from the Azores |
| Minimum | $9,706 | $20,652 |
| Maximum | $119,083 | $91,938 |
| Range | $109,377 | $71,286 |
| Mean | $58,363 | $57,341 |
| Median | $54,623 | $56,819 |
| Interquartile 25% (IQ1) | $51,021 | $46,997 |
| Interquartile 75% (IQ3) | $61,158 | $64,729 |
| Interquartile Range (IQR) | $10,138 | $17,732 |
| Standard Deviation (Sample) | $16,327 | $16,204 |
| Standard Deviation (Population) | $16,208 | $15,912 |
Similar Demographics by Householder Income Under 25 years
Demographics Similar to Italians by Householder Income Under 25 years
In terms of householder income under 25 years, the demographic groups most similar to Italians are Guamanian/Chamorro ($53,423, a difference of 0.010%), Immigrants from Canada ($53,411, a difference of 0.030%), Immigrants from Ethiopia ($53,408, a difference of 0.030%), Immigrants from Iraq ($53,384, a difference of 0.080%), and Colombian ($53,357, a difference of 0.13%).
| Demographics | Rating | Rank | Householder Income Under 25 years |
| Immigrants | Oceania | 97.5 /100 | #112 | Exceptional $53,680 |
| Romanians | 97.2 /100 | #113 | Exceptional $53,632 |
| Immigrants | Sweden | 97.1 /100 | #114 | Exceptional $53,621 |
| Immigrants | Albania | 96.9 /100 | #115 | Exceptional $53,597 |
| Immigrants | Spain | 96.6 /100 | #116 | Exceptional $53,560 |
| Lithuanians | 96.6 /100 | #117 | Exceptional $53,552 |
| Immigrants | Switzerland | 96.3 /100 | #118 | Exceptional $53,528 |
| Italians | 95.4 /100 | #119 | Exceptional $53,426 |
| Guamanians/Chamorros | 95.3 /100 | #120 | Exceptional $53,423 |
| Immigrants | Canada | 95.2 /100 | #121 | Exceptional $53,411 |
| Immigrants | Ethiopia | 95.2 /100 | #122 | Exceptional $53,408 |
| Immigrants | Iraq | 94.9 /100 | #123 | Exceptional $53,384 |
| Colombians | 94.6 /100 | #124 | Exceptional $53,357 |
| Pakistanis | 94.1 /100 | #125 | Exceptional $53,325 |
| Immigrants | Serbia | 94.1 /100 | #126 | Exceptional $53,321 |
Demographics Similar to Immigrants from the Azores by Householder Income Under 25 years
In terms of householder income under 25 years, the demographic groups most similar to Immigrants from the Azores are Central American ($52,626, a difference of 0.010%), Trinidadian and Tobagonian ($52,631, a difference of 0.020%), Immigrants from Denmark ($52,612, a difference of 0.020%), Immigrants from Nepal ($52,611, a difference of 0.020%), and Immigrants from Scotland ($52,638, a difference of 0.030%).
| Demographics | Rating | Rank | Householder Income Under 25 years |
| Latvians | 81.0 /100 | #147 | Excellent $52,783 |
| French Canadians | 76.5 /100 | #148 | Good $52,672 |
| Scandinavians | 75.7 /100 | #149 | Good $52,654 |
| Immigrants | Costa Rica | 75.2 /100 | #150 | Good $52,643 |
| Immigrants | Scotland | 75.0 /100 | #151 | Good $52,638 |
| Trinidadians and Tobagonians | 74.6 /100 | #152 | Good $52,631 |
| Central Americans | 74.4 /100 | #153 | Good $52,626 |
| Immigrants | Azores | 74.2 /100 | #154 | Good $52,621 |
| Immigrants | Denmark | 73.8 /100 | #155 | Good $52,612 |
| Immigrants | Nepal | 73.7 /100 | #156 | Good $52,611 |
| Ghanaians | 72.9 /100 | #157 | Good $52,594 |
| Immigrants | Netherlands | 72.8 /100 | #158 | Good $52,592 |
| Mongolians | 70.2 /100 | #159 | Good $52,540 |
| Immigrants | Turkey | 68.3 /100 | #160 | Good $52,503 |
| Uruguayans | 66.2 /100 | #161 | Good $52,465 |