Italian vs Immigrants from the Azores In Labor Force | Age 16-19
COMPARE
Italian
Immigrants from the Azores
In Labor Force | Age 16-19
In Labor Force | Age 16-19 Comparison
Italians
Immigrants from the Azores
40.1%
IN LABOR FORCE | AGE 16-19
99.9/ 100
METRIC RATING
68th/ 347
METRIC RANK
41.7%
IN LABOR FORCE | AGE 16-19
100.0/ 100
METRIC RATING
36th/ 347
METRIC RANK
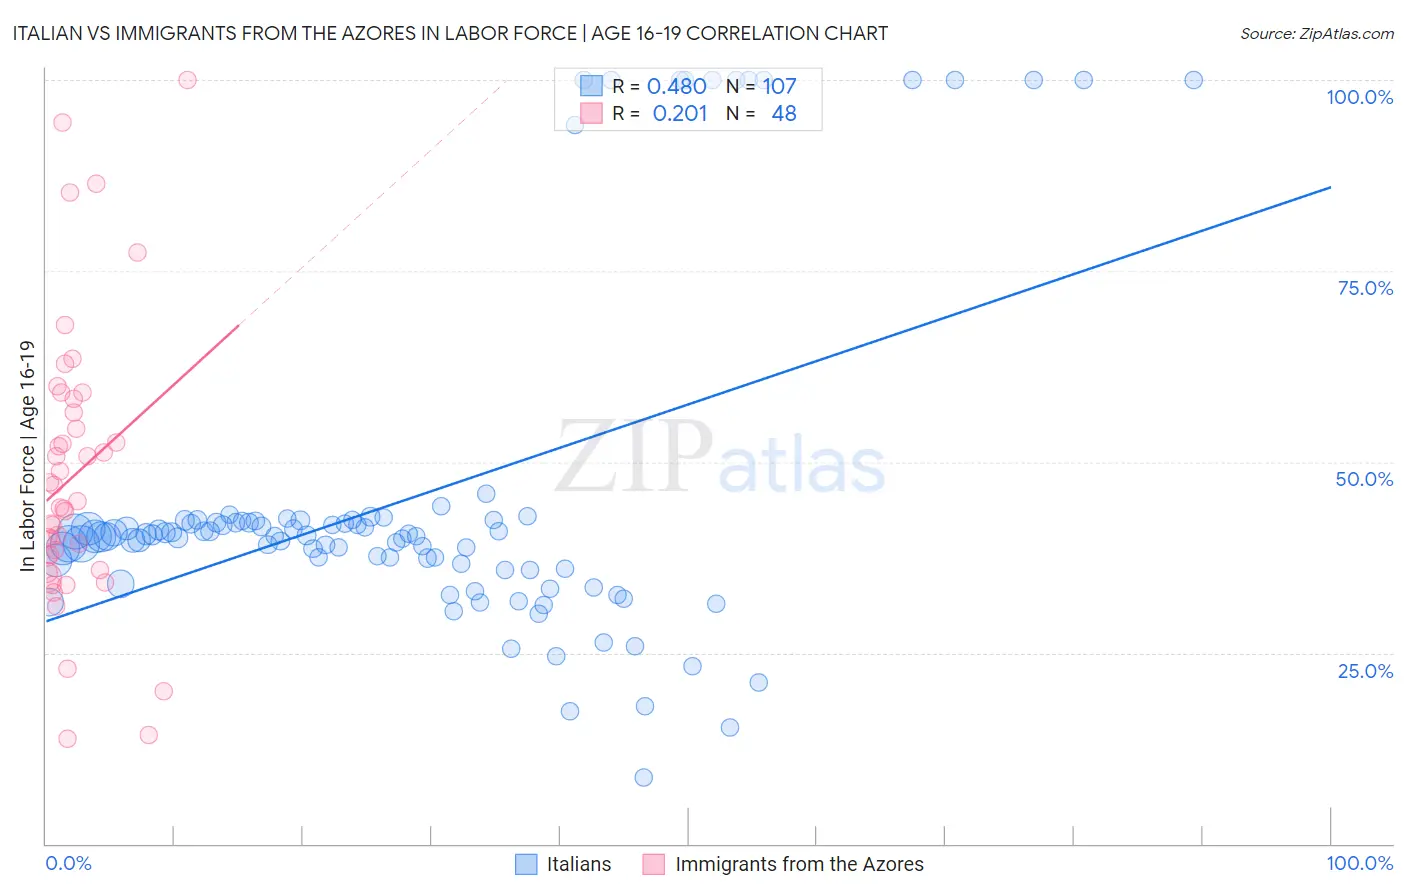
Italian vs Immigrants from the Azores In Labor Force | Age 16-19 Correlation Chart
The statistical analysis conducted on geographies consisting of 570,596,297 people shows a moderate positive correlation between the proportion of Italians and labor force participation rate among population between the ages 16 and 19 in the United States with a correlation coefficient (R) of 0.480 and weighted average of 40.1%. Similarly, the statistical analysis conducted on geographies consisting of 46,224,998 people shows a weak positive correlation between the proportion of Immigrants from the Azores and labor force participation rate among population between the ages 16 and 19 in the United States with a correlation coefficient (R) of 0.201 and weighted average of 41.7%, a difference of 4.1%.
In Labor Force | Age 16-19 Correlation Summary
| Measurement | Italian | Immigrants from the Azores |
| Minimum | 8.6% | 13.8% |
| Maximum | 100.0% | 100.0% |
| Range | 91.4% | 86.2% |
| Mean | 45.2% | 48.2% |
| Median | 40.3% | 44.4% |
| Interquartile 25% (IQ1) | 36.1% | 36.7% |
| Interquartile 75% (IQ3) | 42.3% | 57.4% |
| Interquartile Range (IQR) | 6.2% | 20.7% |
| Standard Deviation (Sample) | 22.2% | 18.5% |
| Standard Deviation (Population) | 22.1% | 18.3% |
Similar Demographics by In Labor Force | Age 16-19
Demographics Similar to Italians by In Labor Force | Age 16-19
In terms of in labor force | age 16-19, the demographic groups most similar to Italians are Canadian (40.1%, a difference of 0.060%), Nonimmigrants (40.1%, a difference of 0.070%), Potawatomi (40.0%, a difference of 0.070%), Portuguese (40.0%, a difference of 0.12%), and Kenyan (40.1%, a difference of 0.19%).
| Demographics | Rating | Rank | In Labor Force | Age 16-19 |
| Americans | 100.0 /100 | #61 | Exceptional 40.3% |
| Cherokee | 100.0 /100 | #62 | Exceptional 40.2% |
| Northern Europeans | 100.0 /100 | #63 | Exceptional 40.2% |
| Immigrants | Micronesia | 100.0 /100 | #64 | Exceptional 40.2% |
| Kenyans | 100.0 /100 | #65 | Exceptional 40.1% |
| Immigrants | Nonimmigrants | 100.0 /100 | #66 | Exceptional 40.1% |
| Canadians | 100.0 /100 | #67 | Exceptional 40.1% |
| Italians | 99.9 /100 | #68 | Exceptional 40.1% |
| Potawatomi | 99.9 /100 | #69 | Exceptional 40.0% |
| Portuguese | 99.9 /100 | #70 | Exceptional 40.0% |
| Serbians | 99.9 /100 | #71 | Exceptional 39.9% |
| Iroquois | 99.9 /100 | #72 | Exceptional 39.9% |
| Immigrants | Middle Africa | 99.9 /100 | #73 | Exceptional 39.9% |
| Hungarians | 99.9 /100 | #74 | Exceptional 39.8% |
| French American Indians | 99.9 /100 | #75 | Exceptional 39.8% |
Demographics Similar to Immigrants from the Azores by In Labor Force | Age 16-19
In terms of in labor force | age 16-19, the demographic groups most similar to Immigrants from the Azores are Immigrants from Congo (41.7%, a difference of 0.080%), Yugoslavian (41.8%, a difference of 0.14%), Immigrants from Bosnia and Herzegovina (41.8%, a difference of 0.16%), Liberian (41.8%, a difference of 0.24%), and Czechoslovakian (41.9%, a difference of 0.38%).
| Demographics | Rating | Rank | In Labor Force | Age 16-19 |
| French | 100.0 /100 | #29 | Exceptional 42.1% |
| Scottish | 100.0 /100 | #30 | Exceptional 42.0% |
| Irish | 100.0 /100 | #31 | Exceptional 42.0% |
| Czechoslovakians | 100.0 /100 | #32 | Exceptional 41.9% |
| Liberians | 100.0 /100 | #33 | Exceptional 41.8% |
| Immigrants | Bosnia and Herzegovina | 100.0 /100 | #34 | Exceptional 41.8% |
| Yugoslavians | 100.0 /100 | #35 | Exceptional 41.8% |
| Immigrants | Azores | 100.0 /100 | #36 | Exceptional 41.7% |
| Immigrants | Congo | 100.0 /100 | #37 | Exceptional 41.7% |
| Sioux | 100.0 /100 | #38 | Exceptional 41.5% |
| Scotch-Irish | 100.0 /100 | #39 | Exceptional 41.5% |
| Immigrants | Liberia | 100.0 /100 | #40 | Exceptional 41.5% |
| Celtics | 100.0 /100 | #41 | Exceptional 41.3% |
| Whites/Caucasians | 100.0 /100 | #42 | Exceptional 41.3% |
| Tongans | 100.0 /100 | #43 | Exceptional 41.2% |