Iroquois vs Afghan Hearing Disability
COMPARE
Iroquois
Afghan
Hearing Disability
Hearing Disability Comparison
Iroquois
Afghans
3.7%
HEARING DISABILITY
0.0/ 100
METRIC RATING
294th/ 347
METRIC RANK
2.7%
HEARING DISABILITY
97.6/ 100
METRIC RATING
72nd/ 347
METRIC RANK
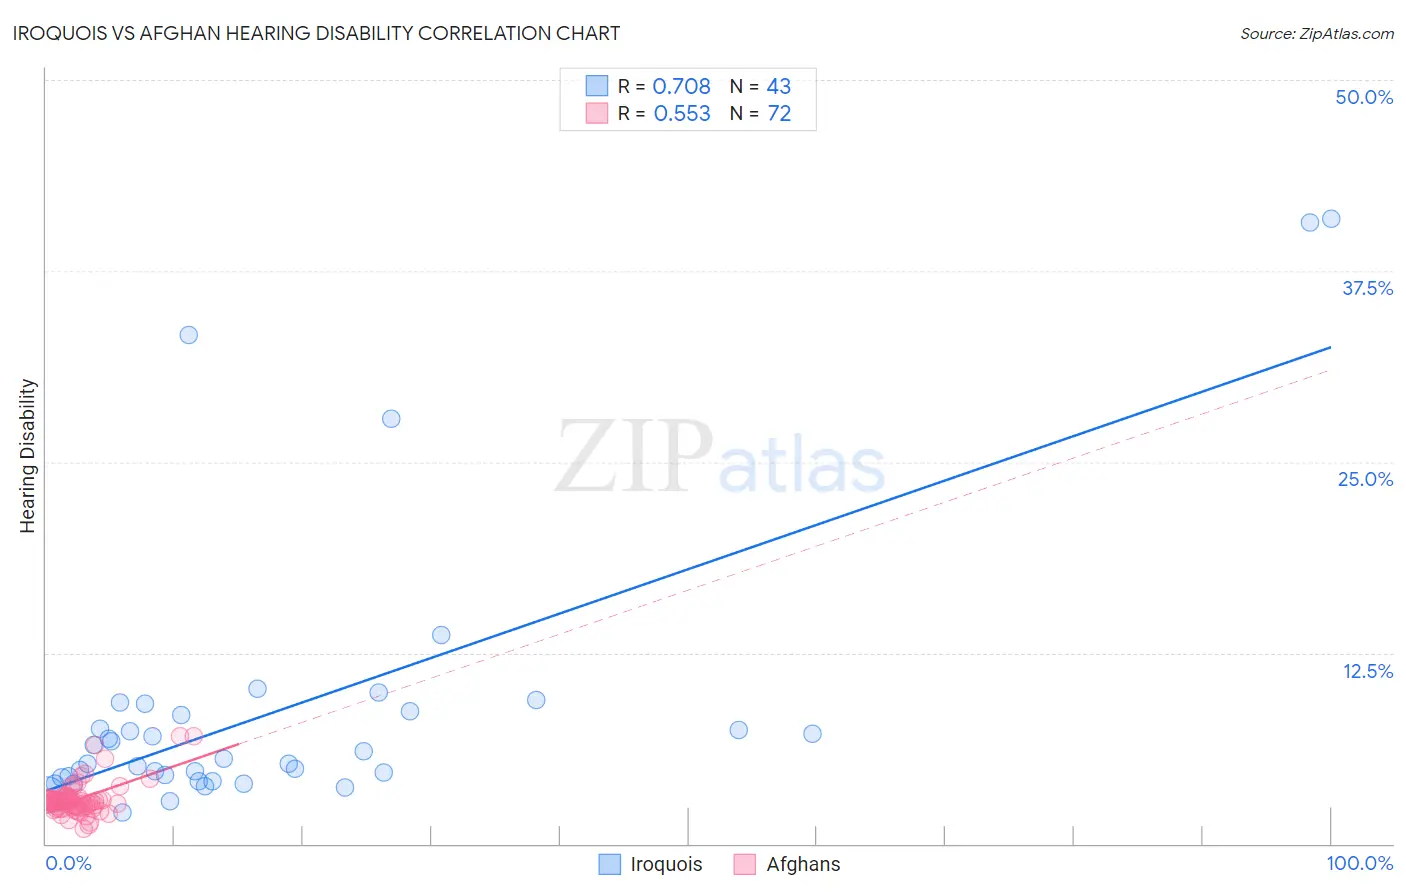
Iroquois vs Afghan Hearing Disability Correlation Chart
The statistical analysis conducted on geographies consisting of 207,234,174 people shows a strong positive correlation between the proportion of Iroquois and percentage of population with hearing disability in the United States with a correlation coefficient (R) of 0.708 and weighted average of 3.7%. Similarly, the statistical analysis conducted on geographies consisting of 148,839,750 people shows a substantial positive correlation between the proportion of Afghans and percentage of population with hearing disability in the United States with a correlation coefficient (R) of 0.553 and weighted average of 2.7%, a difference of 35.2%.
Hearing Disability Correlation Summary
| Measurement | Iroquois | Afghan |
| Minimum | 2.0% | 0.95% |
| Maximum | 40.9% | 7.1% |
| Range | 38.9% | 6.1% |
| Mean | 8.8% | 2.9% |
| Median | 5.6% | 2.7% |
| Interquartile 25% (IQ1) | 4.3% | 2.4% |
| Interquartile 75% (IQ3) | 8.7% | 3.0% |
| Interquartile Range (IQR) | 4.4% | 0.55% |
| Standard Deviation (Sample) | 9.2% | 1.1% |
| Standard Deviation (Population) | 9.1% | 1.1% |
Similar Demographics by Hearing Disability
Demographics Similar to Iroquois by Hearing Disability
In terms of hearing disability, the demographic groups most similar to Iroquois are Norwegian (3.7%, a difference of 0.24%), Welsh (3.7%, a difference of 0.27%), Native Hawaiian (3.7%, a difference of 0.30%), Finnish (3.7%, a difference of 0.36%), and White/Caucasian (3.7%, a difference of 0.37%).
| Demographics | Rating | Rank | Hearing Disability |
| Spanish | 0.0 /100 | #287 | Tragic 3.7% |
| Irish | 0.0 /100 | #288 | Tragic 3.7% |
| Chinese | 0.0 /100 | #289 | Tragic 3.7% |
| Whites/Caucasians | 0.0 /100 | #290 | Tragic 3.7% |
| Finns | 0.0 /100 | #291 | Tragic 3.7% |
| Native Hawaiians | 0.0 /100 | #292 | Tragic 3.7% |
| Norwegians | 0.0 /100 | #293 | Tragic 3.7% |
| Iroquois | 0.0 /100 | #294 | Tragic 3.7% |
| Welsh | 0.0 /100 | #295 | Tragic 3.7% |
| Pima | 0.0 /100 | #296 | Tragic 3.7% |
| Immigrants | Azores | 0.0 /100 | #297 | Tragic 3.7% |
| Celtics | 0.0 /100 | #298 | Tragic 3.7% |
| Germans | 0.0 /100 | #299 | Tragic 3.7% |
| Scottish | 0.0 /100 | #300 | Tragic 3.7% |
| Pennsylvania Germans | 0.0 /100 | #301 | Tragic 3.7% |
Demographics Similar to Afghans by Hearing Disability
In terms of hearing disability, the demographic groups most similar to Afghans are Argentinean (2.7%, a difference of 0.080%), Immigrants from Korea (2.7%, a difference of 0.080%), Central American (2.7%, a difference of 0.10%), Immigrants from Saudi Arabia (2.7%, a difference of 0.11%), and Asian (2.7%, a difference of 0.11%).
| Demographics | Rating | Rank | Hearing Disability |
| Immigrants | Nepal | 98.3 /100 | #65 | Exceptional 2.7% |
| Immigrants | Belize | 98.2 /100 | #66 | Exceptional 2.7% |
| Egyptians | 98.1 /100 | #67 | Exceptional 2.7% |
| Immigrants | Africa | 98.0 /100 | #68 | Exceptional 2.7% |
| Nicaraguans | 97.9 /100 | #69 | Exceptional 2.7% |
| Peruvians | 97.7 /100 | #70 | Exceptional 2.7% |
| Central Americans | 97.7 /100 | #71 | Exceptional 2.7% |
| Afghans | 97.6 /100 | #72 | Exceptional 2.7% |
| Argentineans | 97.5 /100 | #73 | Exceptional 2.7% |
| Immigrants | Korea | 97.5 /100 | #74 | Exceptional 2.7% |
| Immigrants | Saudi Arabia | 97.5 /100 | #75 | Exceptional 2.7% |
| Asians | 97.5 /100 | #76 | Exceptional 2.7% |
| Immigrants | Malaysia | 97.5 /100 | #77 | Exceptional 2.7% |
| Mongolians | 97.4 /100 | #78 | Exceptional 2.7% |
| Colombians | 97.4 /100 | #79 | Exceptional 2.7% |