Irish vs Immigrants from Sierra Leone In Labor Force | Age > 16
COMPARE
Irish
Immigrants from Sierra Leone
In Labor Force | Age > 16
In Labor Force | Age > 16 Comparison
Irish
Immigrants from Sierra Leone
64.1%
IN LABOR FORCE | AGE > 16
0.4/ 100
METRIC RATING
269th/ 347
METRIC RANK
68.5%
IN LABOR FORCE | AGE > 16
100.0/ 100
METRIC RATING
8th/ 347
METRIC RANK
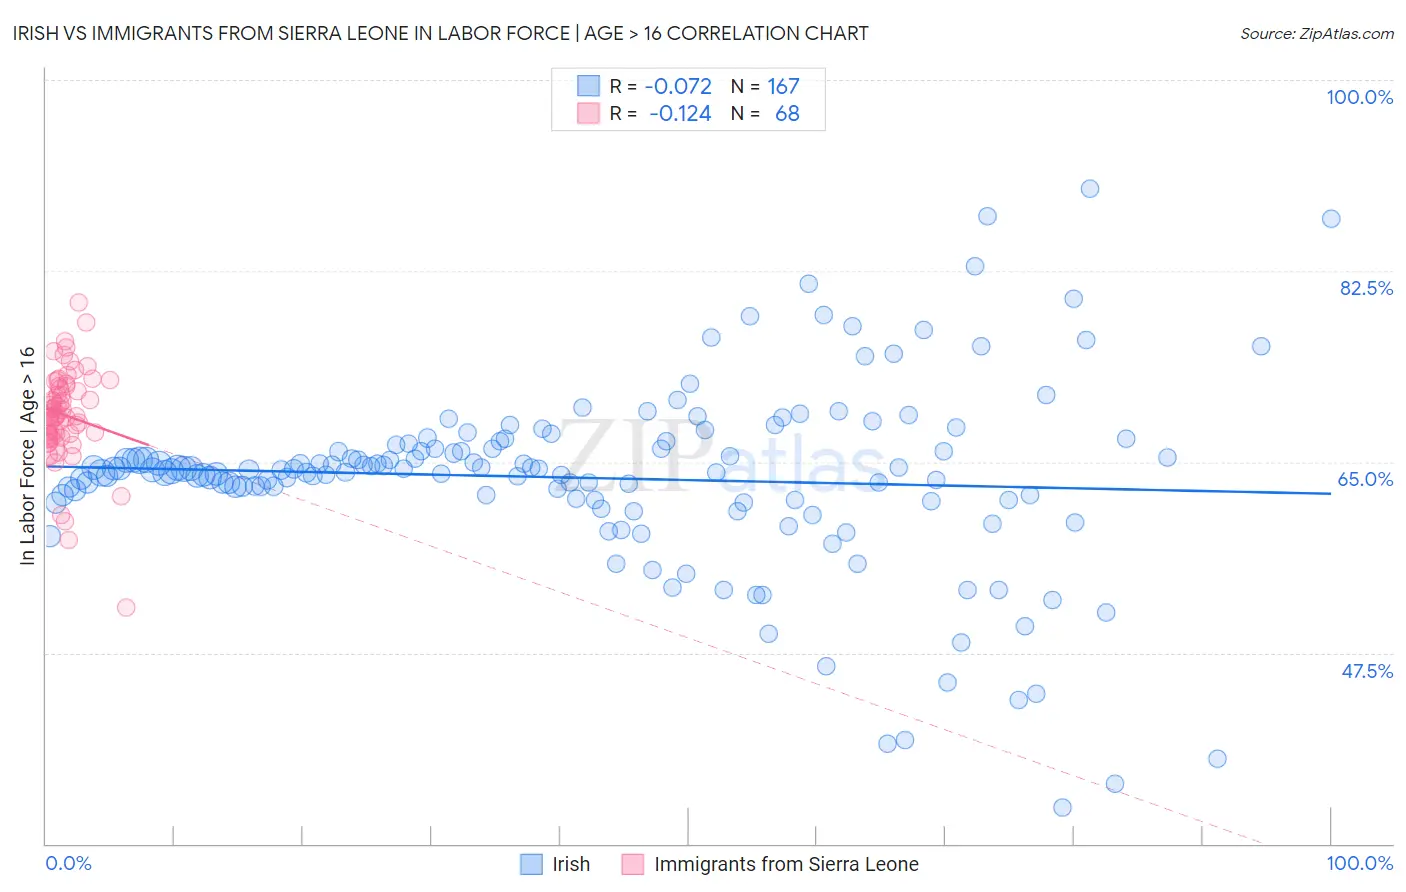
Irish vs Immigrants from Sierra Leone In Labor Force | Age > 16 Correlation Chart
The statistical analysis conducted on geographies consisting of 580,699,794 people shows a slight negative correlation between the proportion of Irish and labor force participation rate among population ages 16 and over in the United States with a correlation coefficient (R) of -0.072 and weighted average of 64.1%. Similarly, the statistical analysis conducted on geographies consisting of 101,649,709 people shows a poor negative correlation between the proportion of Immigrants from Sierra Leone and labor force participation rate among population ages 16 and over in the United States with a correlation coefficient (R) of -0.124 and weighted average of 68.5%, a difference of 6.8%.
In Labor Force | Age > 16 Correlation Summary
| Measurement | Irish | Immigrants from Sierra Leone |
| Minimum | 33.3% | 51.7% |
| Maximum | 90.0% | 79.6% |
| Range | 56.7% | 27.9% |
| Mean | 63.5% | 69.3% |
| Median | 64.3% | 69.3% |
| Interquartile 25% (IQ1) | 61.5% | 67.5% |
| Interquartile 75% (IQ3) | 66.6% | 71.9% |
| Interquartile Range (IQR) | 5.1% | 4.5% |
| Standard Deviation (Sample) | 8.6% | 4.4% |
| Standard Deviation (Population) | 8.6% | 4.4% |
Similar Demographics by In Labor Force | Age > 16
Demographics Similar to Irish by In Labor Force | Age > 16
In terms of in labor force | age > 16, the demographic groups most similar to Irish are Guyanese (64.1%, a difference of 0.030%), Dominican (64.1%, a difference of 0.030%), Canadian (64.1%, a difference of 0.040%), Spaniard (64.1%, a difference of 0.040%), and Immigrants from England (64.2%, a difference of 0.050%).
| Demographics | Rating | Rank | In Labor Force | Age > 16 |
| Finns | 0.7 /100 | #262 | Tragic 64.2% |
| Bahamians | 0.6 /100 | #263 | Tragic 64.2% |
| Dutch | 0.6 /100 | #264 | Tragic 64.2% |
| Cubans | 0.5 /100 | #265 | Tragic 64.2% |
| Immigrants | England | 0.5 /100 | #266 | Tragic 64.2% |
| Canadians | 0.5 /100 | #267 | Tragic 64.1% |
| Spaniards | 0.5 /100 | #268 | Tragic 64.1% |
| Irish | 0.4 /100 | #269 | Tragic 64.1% |
| Guyanese | 0.4 /100 | #270 | Tragic 64.1% |
| Dominicans | 0.4 /100 | #271 | Tragic 64.1% |
| Native Hawaiians | 0.3 /100 | #272 | Tragic 64.1% |
| Hmong | 0.3 /100 | #273 | Tragic 64.1% |
| Immigrants | Cuba | 0.3 /100 | #274 | Tragic 64.1% |
| Mexicans | 0.3 /100 | #275 | Tragic 64.1% |
| French American Indians | 0.3 /100 | #276 | Tragic 64.1% |
Demographics Similar to Immigrants from Sierra Leone by In Labor Force | Age > 16
In terms of in labor force | age > 16, the demographic groups most similar to Immigrants from Sierra Leone are Immigrants from Eastern Africa (68.5%, a difference of 0.010%), Immigrants from Bolivia (68.4%, a difference of 0.050%), Immigrants from Cameroon (68.7%, a difference of 0.32%), Bolivian (68.2%, a difference of 0.41%), and Immigrants from Eritrea (68.9%, a difference of 0.57%).
| Demographics | Rating | Rank | In Labor Force | Age > 16 |
| Immigrants | Ethiopia | 100.0 /100 | #1 | Exceptional 69.4% |
| Ethiopians | 100.0 /100 | #2 | Exceptional 69.3% |
| Somalis | 100.0 /100 | #3 | Exceptional 69.2% |
| Immigrants | Somalia | 100.0 /100 | #4 | Exceptional 69.1% |
| Sierra Leoneans | 100.0 /100 | #5 | Exceptional 68.9% |
| Immigrants | Eritrea | 100.0 /100 | #6 | Exceptional 68.9% |
| Immigrants | Cameroon | 100.0 /100 | #7 | Exceptional 68.7% |
| Immigrants | Sierra Leone | 100.0 /100 | #8 | Exceptional 68.5% |
| Immigrants | Eastern Africa | 100.0 /100 | #9 | Exceptional 68.5% |
| Immigrants | Bolivia | 100.0 /100 | #10 | Exceptional 68.4% |
| Bolivians | 100.0 /100 | #11 | Exceptional 68.2% |
| Sudanese | 100.0 /100 | #12 | Exceptional 68.0% |
| Immigrants | Nepal | 100.0 /100 | #13 | Exceptional 68.0% |
| Liberians | 100.0 /100 | #14 | Exceptional 67.8% |
| Immigrants | Middle Africa | 100.0 /100 | #15 | Exceptional 67.7% |