Irish vs Immigrants from Sierra Leone Births to Unmarried Women
COMPARE
Irish
Immigrants from Sierra Leone
Births to Unmarried Women
Births to Unmarried Women Comparison
Irish
Immigrants from Sierra Leone
32.2%
BIRTHS TO UNMARRIED WOMEN
32.4/ 100
METRIC RATING
191st/ 347
METRIC RANK
34.2%
BIRTHS TO UNMARRIED WOMEN
3.1/ 100
METRIC RATING
229th/ 347
METRIC RANK
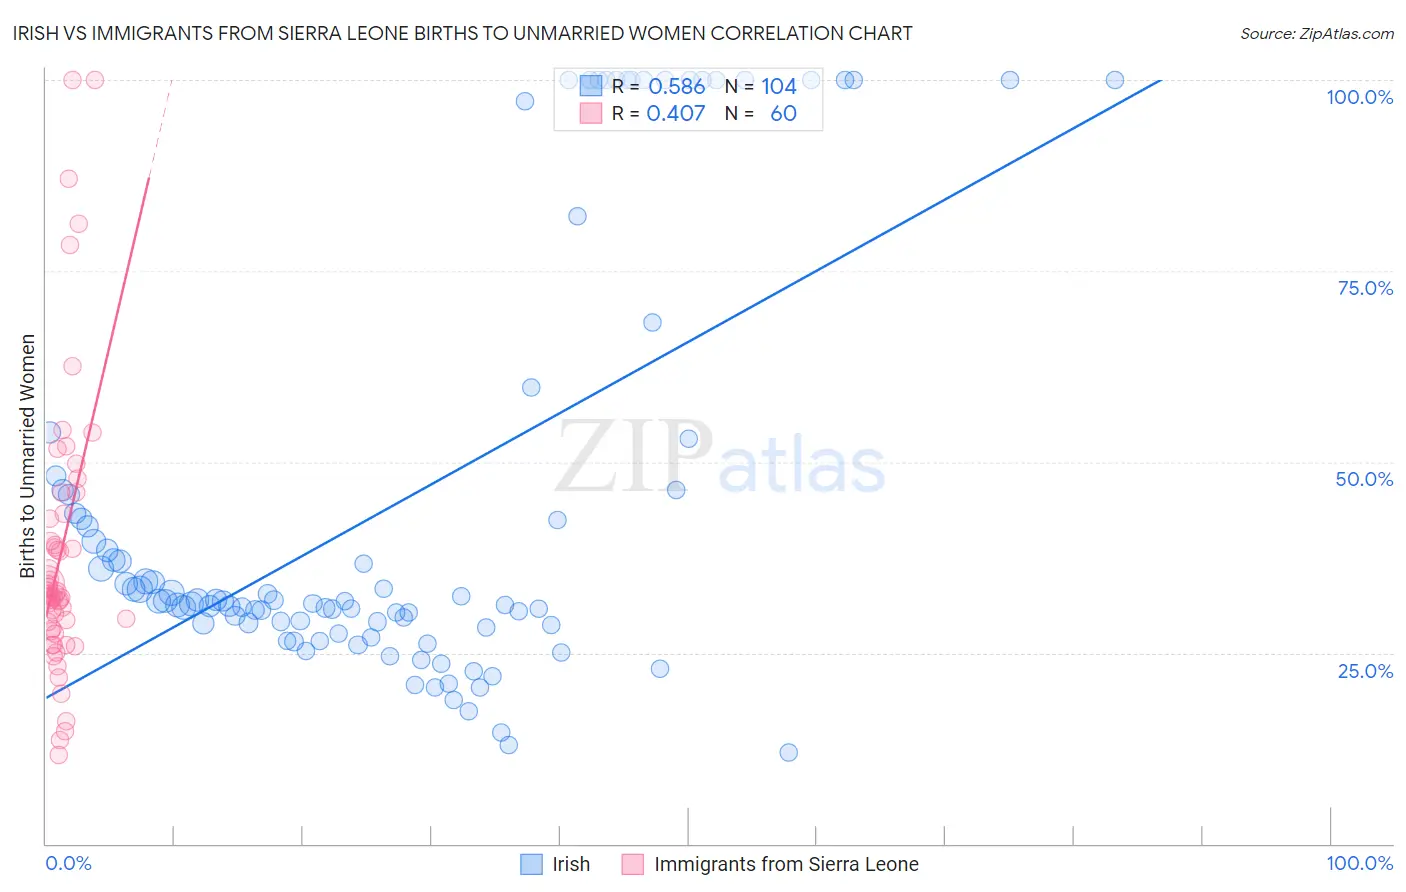
Irish vs Immigrants from Sierra Leone Births to Unmarried Women Correlation Chart
The statistical analysis conducted on geographies consisting of 510,434,207 people shows a substantial positive correlation between the proportion of Irish and percentage of births to unmarried women in the United States with a correlation coefficient (R) of 0.586 and weighted average of 32.2%. Similarly, the statistical analysis conducted on geographies consisting of 99,540,756 people shows a moderate positive correlation between the proportion of Immigrants from Sierra Leone and percentage of births to unmarried women in the United States with a correlation coefficient (R) of 0.407 and weighted average of 34.2%, a difference of 6.3%.
Births to Unmarried Women Correlation Summary
| Measurement | Irish | Immigrants from Sierra Leone |
| Minimum | 11.9% | 11.7% |
| Maximum | 100.0% | 100.0% |
| Range | 88.1% | 88.3% |
| Mean | 44.6% | 38.2% |
| Median | 31.8% | 32.6% |
| Interquartile 25% (IQ1) | 28.8% | 28.0% |
| Interquartile 75% (IQ3) | 46.3% | 42.9% |
| Interquartile Range (IQR) | 17.6% | 14.9% |
| Standard Deviation (Sample) | 28.0% | 18.7% |
| Standard Deviation (Population) | 27.9% | 18.6% |
Similar Demographics by Births to Unmarried Women
Demographics Similar to Irish by Births to Unmarried Women
In terms of births to unmarried women, the demographic groups most similar to Irish are Tlingit-Haida (32.2%, a difference of 0.020%), Colombian (32.2%, a difference of 0.050%), Fijian (32.3%, a difference of 0.14%), Immigrants from Kenya (32.1%, a difference of 0.46%), and Osage (32.1%, a difference of 0.49%).
| Demographics | Rating | Rank | Births to Unmarried Women |
| Immigrants | South America | 40.7 /100 | #184 | Average 32.0% |
| Germans | 39.5 /100 | #185 | Fair 32.0% |
| Welsh | 38.2 /100 | #186 | Fair 32.0% |
| Czechoslovakians | 38.0 /100 | #187 | Fair 32.0% |
| Osage | 37.1 /100 | #188 | Fair 32.1% |
| Immigrants | Kenya | 36.9 /100 | #189 | Fair 32.1% |
| Tlingit-Haida | 32.6 /100 | #190 | Fair 32.2% |
| Irish | 32.4 /100 | #191 | Fair 32.2% |
| Colombians | 31.9 /100 | #192 | Fair 32.2% |
| Fijians | 31.1 /100 | #193 | Fair 32.3% |
| Sudanese | 27.3 /100 | #194 | Fair 32.4% |
| Samoans | 21.9 /100 | #195 | Fair 32.6% |
| Immigrants | Colombia | 21.7 /100 | #196 | Fair 32.6% |
| Immigrants | Immigrants | 20.6 /100 | #197 | Fair 32.7% |
| Costa Ricans | 20.3 /100 | #198 | Fair 32.7% |
Demographics Similar to Immigrants from Sierra Leone by Births to Unmarried Women
In terms of births to unmarried women, the demographic groups most similar to Immigrants from Sierra Leone are Ghanaian (34.3%, a difference of 0.020%), Panamanian (34.2%, a difference of 0.11%), Immigrants from Panama (34.2%, a difference of 0.14%), Delaware (34.2%, a difference of 0.16%), and Native Hawaiian (34.3%, a difference of 0.17%).
| Demographics | Rating | Rank | Births to Unmarried Women |
| Immigrants | Uruguay | 4.8 /100 | #222 | Tragic 33.9% |
| Pennsylvania Germans | 4.3 /100 | #223 | Tragic 34.0% |
| Immigrants | Laos | 4.3 /100 | #224 | Tragic 34.0% |
| Spanish | 4.0 /100 | #225 | Tragic 34.1% |
| Delaware | 3.3 /100 | #226 | Tragic 34.2% |
| Immigrants | Panama | 3.3 /100 | #227 | Tragic 34.2% |
| Panamanians | 3.3 /100 | #228 | Tragic 34.2% |
| Immigrants | Sierra Leone | 3.1 /100 | #229 | Tragic 34.2% |
| Ghanaians | 3.1 /100 | #230 | Tragic 34.3% |
| Native Hawaiians | 2.9 /100 | #231 | Tragic 34.3% |
| French Canadians | 2.5 /100 | #232 | Tragic 34.4% |
| Bangladeshis | 2.5 /100 | #233 | Tragic 34.4% |
| Immigrants | Zaire | 2.3 /100 | #234 | Tragic 34.5% |
| Immigrants | Ghana | 2.2 /100 | #235 | Tragic 34.5% |
| Immigrants | Cameroon | 1.6 /100 | #236 | Tragic 34.7% |