Irish vs Immigrants from Sierra Leone 10th Grade
COMPARE
Irish
Immigrants from Sierra Leone
10th Grade
10th Grade Comparison
Irish
Immigrants from Sierra Leone
95.6%
10TH GRADE
100.0/ 100
METRIC RATING
15th/ 347
METRIC RANK
93.2%
10TH GRADE
7.6/ 100
METRIC RATING
223rd/ 347
METRIC RANK
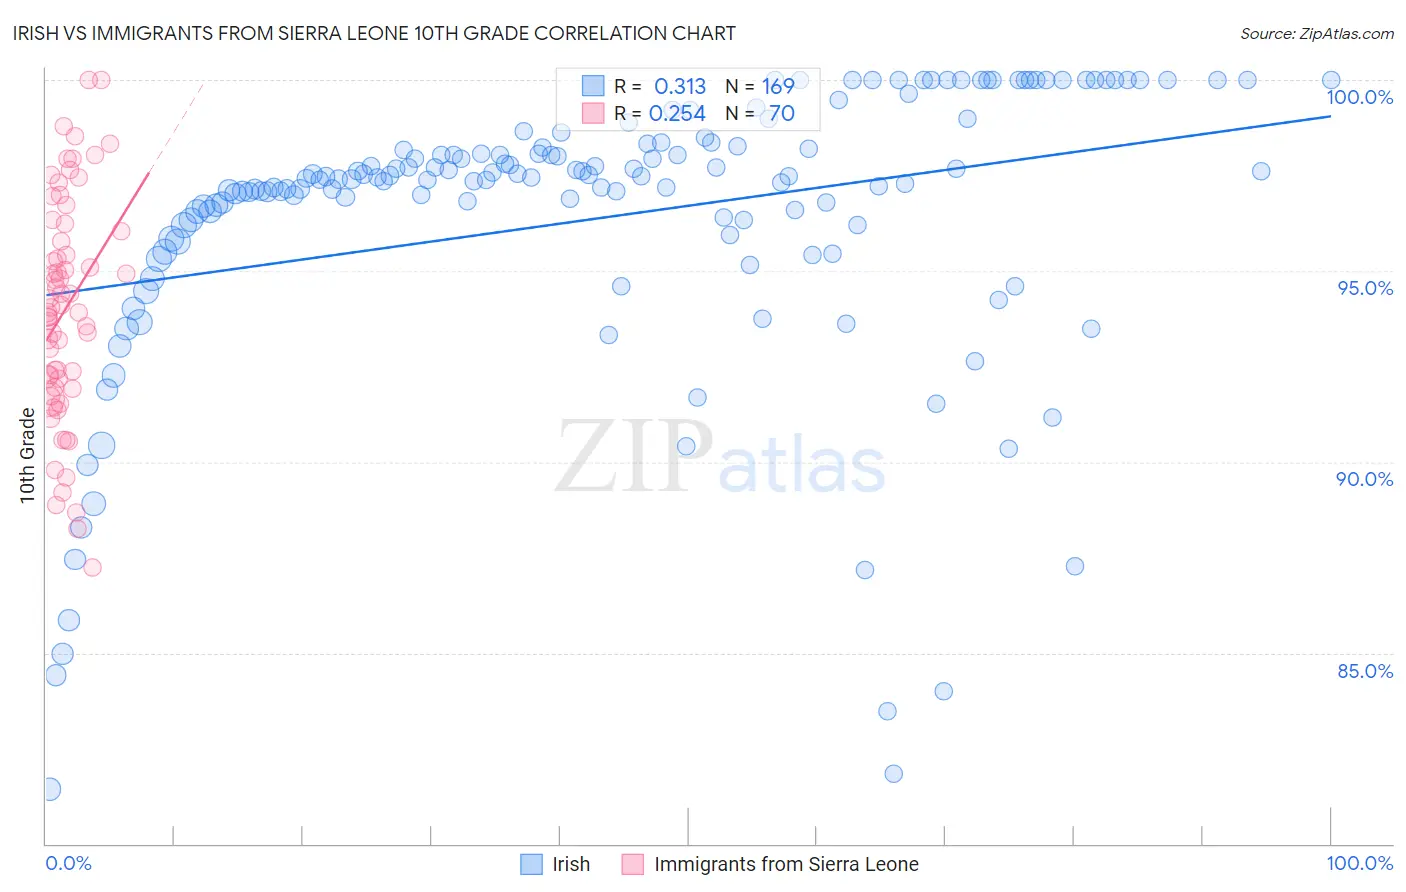
Irish vs Immigrants from Sierra Leone 10th Grade Correlation Chart
The statistical analysis conducted on geographies consisting of 580,709,891 people shows a mild positive correlation between the proportion of Irish and percentage of population with at least 10th grade education in the United States with a correlation coefficient (R) of 0.313 and weighted average of 95.6%. Similarly, the statistical analysis conducted on geographies consisting of 101,634,956 people shows a weak positive correlation between the proportion of Immigrants from Sierra Leone and percentage of population with at least 10th grade education in the United States with a correlation coefficient (R) of 0.254 and weighted average of 93.2%, a difference of 2.6%.
10th Grade Correlation Summary
| Measurement | Irish | Immigrants from Sierra Leone |
| Minimum | 81.4% | 87.2% |
| Maximum | 100.0% | 100.0% |
| Range | 18.6% | 12.8% |
| Mean | 96.4% | 94.0% |
| Median | 97.4% | 94.0% |
| Interquartile 25% (IQ1) | 95.9% | 91.9% |
| Interquartile 75% (IQ3) | 98.3% | 96.1% |
| Interquartile Range (IQR) | 2.4% | 4.1% |
| Standard Deviation (Sample) | 3.8% | 2.9% |
| Standard Deviation (Population) | 3.8% | 2.9% |
Similar Demographics by 10th Grade
Demographics Similar to Irish by 10th Grade
In terms of 10th grade, the demographic groups most similar to Irish are Scottish (95.6%, a difference of 0.010%), Tsimshian (95.6%, a difference of 0.020%), Latvian (95.6%, a difference of 0.020%), English (95.6%, a difference of 0.030%), and Italian (95.6%, a difference of 0.030%).
| Demographics | Rating | Rank | 10th Grade |
| Lithuanians | 100.0 /100 | #8 | Exceptional 95.8% |
| Finns | 100.0 /100 | #9 | Exceptional 95.8% |
| Croatians | 100.0 /100 | #10 | Exceptional 95.7% |
| Danes | 100.0 /100 | #11 | Exceptional 95.7% |
| Tlingit-Haida | 100.0 /100 | #12 | Exceptional 95.7% |
| English | 100.0 /100 | #13 | Exceptional 95.6% |
| Tsimshian | 100.0 /100 | #14 | Exceptional 95.6% |
| Irish | 100.0 /100 | #15 | Exceptional 95.6% |
| Scottish | 100.0 /100 | #16 | Exceptional 95.6% |
| Latvians | 100.0 /100 | #17 | Exceptional 95.6% |
| Italians | 100.0 /100 | #18 | Exceptional 95.6% |
| Scandinavians | 100.0 /100 | #19 | Exceptional 95.6% |
| Chinese | 100.0 /100 | #20 | Exceptional 95.5% |
| Dutch | 100.0 /100 | #21 | Exceptional 95.5% |
| Eastern Europeans | 100.0 /100 | #22 | Exceptional 95.5% |
Demographics Similar to Immigrants from Sierra Leone by 10th Grade
In terms of 10th grade, the demographic groups most similar to Immigrants from Sierra Leone are Ethiopian (93.2%, a difference of 0.010%), Bolivian (93.2%, a difference of 0.030%), Immigrants from Southern Europe (93.2%, a difference of 0.040%), Tongan (93.3%, a difference of 0.050%), and Somali (93.2%, a difference of 0.050%).
| Demographics | Rating | Rank | 10th Grade |
| Immigrants | Eastern Africa | 14.7 /100 | #216 | Poor 93.4% |
| Portuguese | 12.1 /100 | #217 | Poor 93.3% |
| Immigrants | Liberia | 10.2 /100 | #218 | Poor 93.3% |
| Seminole | 10.2 /100 | #219 | Poor 93.3% |
| Tongans | 9.5 /100 | #220 | Tragic 93.3% |
| Immigrants | Southern Europe | 8.9 /100 | #221 | Tragic 93.2% |
| Ethiopians | 7.9 /100 | #222 | Tragic 93.2% |
| Immigrants | Sierra Leone | 7.6 /100 | #223 | Tragic 93.2% |
| Bolivians | 6.7 /100 | #224 | Tragic 93.2% |
| Somalis | 6.2 /100 | #225 | Tragic 93.2% |
| Koreans | 6.1 /100 | #226 | Tragic 93.2% |
| Blacks/African Americans | 6.0 /100 | #227 | Tragic 93.2% |
| Immigrants | China | 5.9 /100 | #228 | Tragic 93.2% |
| Immigrants | Ethiopia | 5.1 /100 | #229 | Tragic 93.1% |
| Immigrants | Africa | 5.0 /100 | #230 | Tragic 93.1% |