Irish vs Immigrants from Norway Median Female Earnings
COMPARE
Irish
Immigrants from Norway
Median Female Earnings
Median Female Earnings Comparison
Irish
Immigrants from Norway
$39,291
MEDIAN FEMALE EARNINGS
30.0/ 100
METRIC RATING
194th/ 347
METRIC RANK
$42,837
MEDIAN FEMALE EARNINGS
99.9/ 100
METRIC RATING
66th/ 347
METRIC RANK
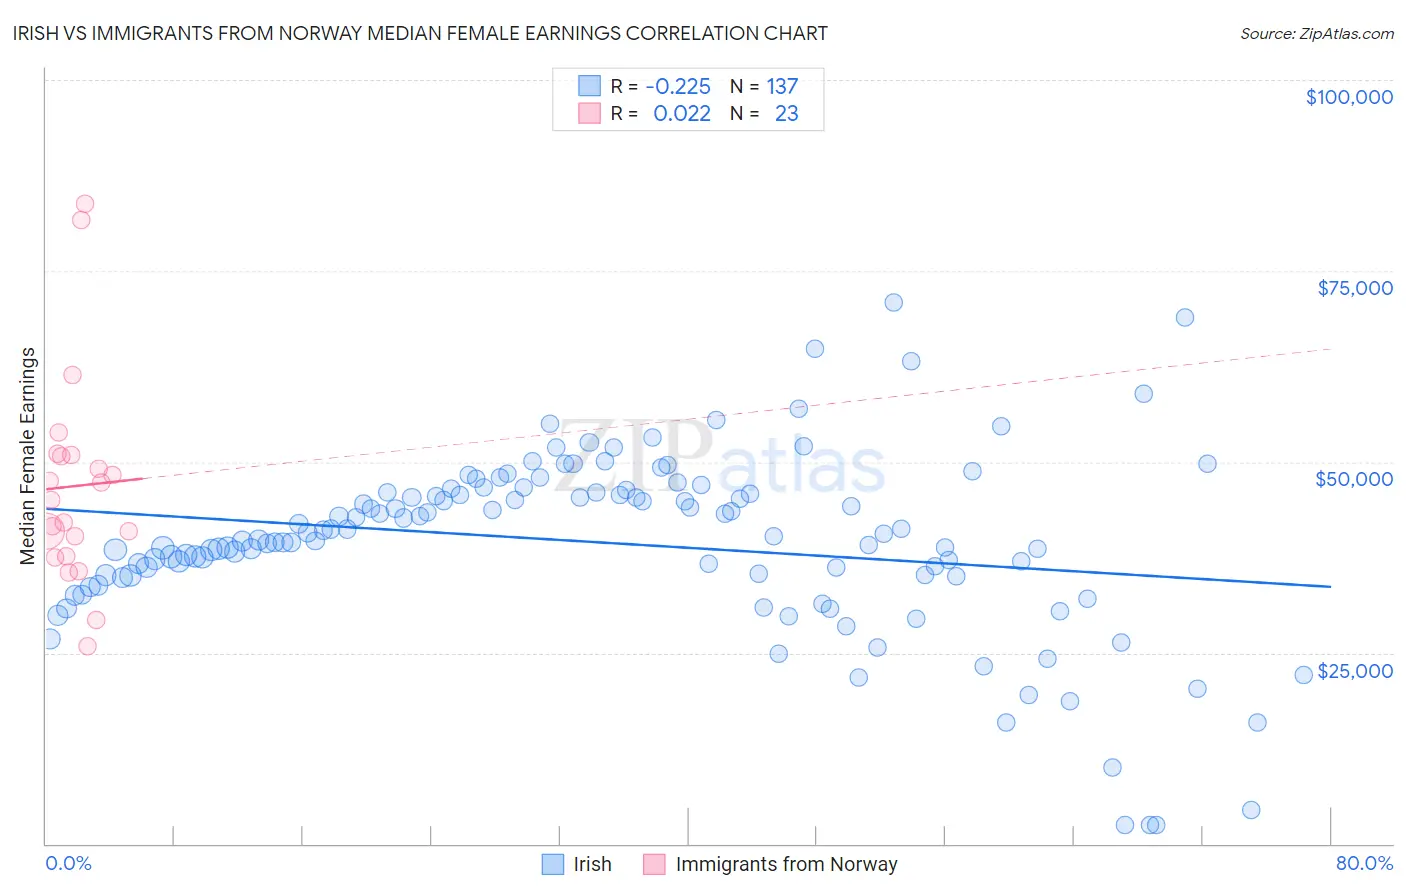
Irish vs Immigrants from Norway Median Female Earnings Correlation Chart
The statistical analysis conducted on geographies consisting of 577,855,613 people shows a weak negative correlation between the proportion of Irish and median female earnings in the United States with a correlation coefficient (R) of -0.225 and weighted average of $39,291. Similarly, the statistical analysis conducted on geographies consisting of 116,697,364 people shows no correlation between the proportion of Immigrants from Norway and median female earnings in the United States with a correlation coefficient (R) of 0.022 and weighted average of $42,837, a difference of 9.0%.
Median Female Earnings Correlation Summary
| Measurement | Irish | Immigrants from Norway |
| Minimum | $2,499 | $25,783 |
| Maximum | $70,827 | $83,727 |
| Range | $68,328 | $57,944 |
| Mean | $39,404 | $46,834 |
| Median | $40,229 | $44,998 |
| Interquartile 25% (IQ1) | $35,070 | $37,628 |
| Interquartile 75% (IQ3) | $45,938 | $50,939 |
| Interquartile Range (IQR) | $10,868 | $13,311 |
| Standard Deviation (Sample) | $11,843 | $13,874 |
| Standard Deviation (Population) | $11,799 | $13,569 |
Similar Demographics by Median Female Earnings
Demographics Similar to Irish by Median Female Earnings
In terms of median female earnings, the demographic groups most similar to Irish are Immigrants from Nigeria ($39,294, a difference of 0.010%), Immigrants ($39,328, a difference of 0.090%), Immigrants from Western Africa ($39,351, a difference of 0.15%), Uruguayan ($39,228, a difference of 0.16%), and Puget Sound Salish ($39,376, a difference of 0.22%).
| Demographics | Rating | Rank | Median Female Earnings |
| Swedes | 36.0 /100 | #187 | Fair $39,421 |
| Bermudans | 35.9 /100 | #188 | Fair $39,418 |
| Senegalese | 34.2 /100 | #189 | Fair $39,384 |
| Puget Sound Salish | 33.9 /100 | #190 | Fair $39,376 |
| Immigrants | Western Africa | 32.7 /100 | #191 | Fair $39,351 |
| Immigrants | Immigrants | 31.7 /100 | #192 | Fair $39,328 |
| Immigrants | Nigeria | 30.2 /100 | #193 | Fair $39,294 |
| Irish | 30.0 /100 | #194 | Fair $39,291 |
| Uruguayans | 27.3 /100 | #195 | Fair $39,228 |
| Immigrants | Costa Rica | 25.6 /100 | #196 | Fair $39,186 |
| Assyrians/Chaldeans/Syriacs | 24.6 /100 | #197 | Fair $39,159 |
| Ecuadorians | 23.0 /100 | #198 | Fair $39,117 |
| Icelanders | 22.7 /100 | #199 | Fair $39,109 |
| Immigrants | Panama | 20.6 /100 | #200 | Fair $39,049 |
| Panamanians | 20.6 /100 | #201 | Fair $39,049 |
Demographics Similar to Immigrants from Norway by Median Female Earnings
In terms of median female earnings, the demographic groups most similar to Immigrants from Norway are Immigrants from Egypt ($42,837, a difference of 0.0%), Immigrants from Austria ($42,824, a difference of 0.030%), Immigrants from Spain ($42,815, a difference of 0.050%), Sierra Leonean ($42,868, a difference of 0.070%), and Immigrants from Ethiopia ($42,744, a difference of 0.22%).
| Demographics | Rating | Rank | Median Female Earnings |
| Estonians | 99.9 /100 | #59 | Exceptional $43,106 |
| Immigrants | Latvia | 99.9 /100 | #60 | Exceptional $43,099 |
| Immigrants | Bulgaria | 99.9 /100 | #61 | Exceptional $43,085 |
| Afghans | 99.9 /100 | #62 | Exceptional $43,077 |
| Immigrants | Ukraine | 99.9 /100 | #63 | Exceptional $43,069 |
| Immigrants | Pakistan | 99.9 /100 | #64 | Exceptional $43,052 |
| Sierra Leoneans | 99.9 /100 | #65 | Exceptional $42,868 |
| Immigrants | Norway | 99.9 /100 | #66 | Exceptional $42,837 |
| Immigrants | Egypt | 99.9 /100 | #67 | Exceptional $42,837 |
| Immigrants | Austria | 99.8 /100 | #68 | Exceptional $42,824 |
| Immigrants | Spain | 99.8 /100 | #69 | Exceptional $42,815 |
| Immigrants | Ethiopia | 99.8 /100 | #70 | Exceptional $42,744 |
| Immigrants | Romania | 99.8 /100 | #71 | Exceptional $42,718 |
| Albanians | 99.8 /100 | #72 | Exceptional $42,584 |
| Mongolians | 99.7 /100 | #73 | Exceptional $42,542 |