Moroccan vs Yup'ik Cognitive Disability
COMPARE
Moroccan
Yup'ik
Cognitive Disability
Cognitive Disability Comparison
Moroccans
Yup'ik
17.6%
COGNITIVE DISABILITY
5.9/ 100
METRIC RATING
221st/ 347
METRIC RANK
16.9%
COGNITIVE DISABILITY
96.9/ 100
METRIC RATING
115th/ 347
METRIC RANK
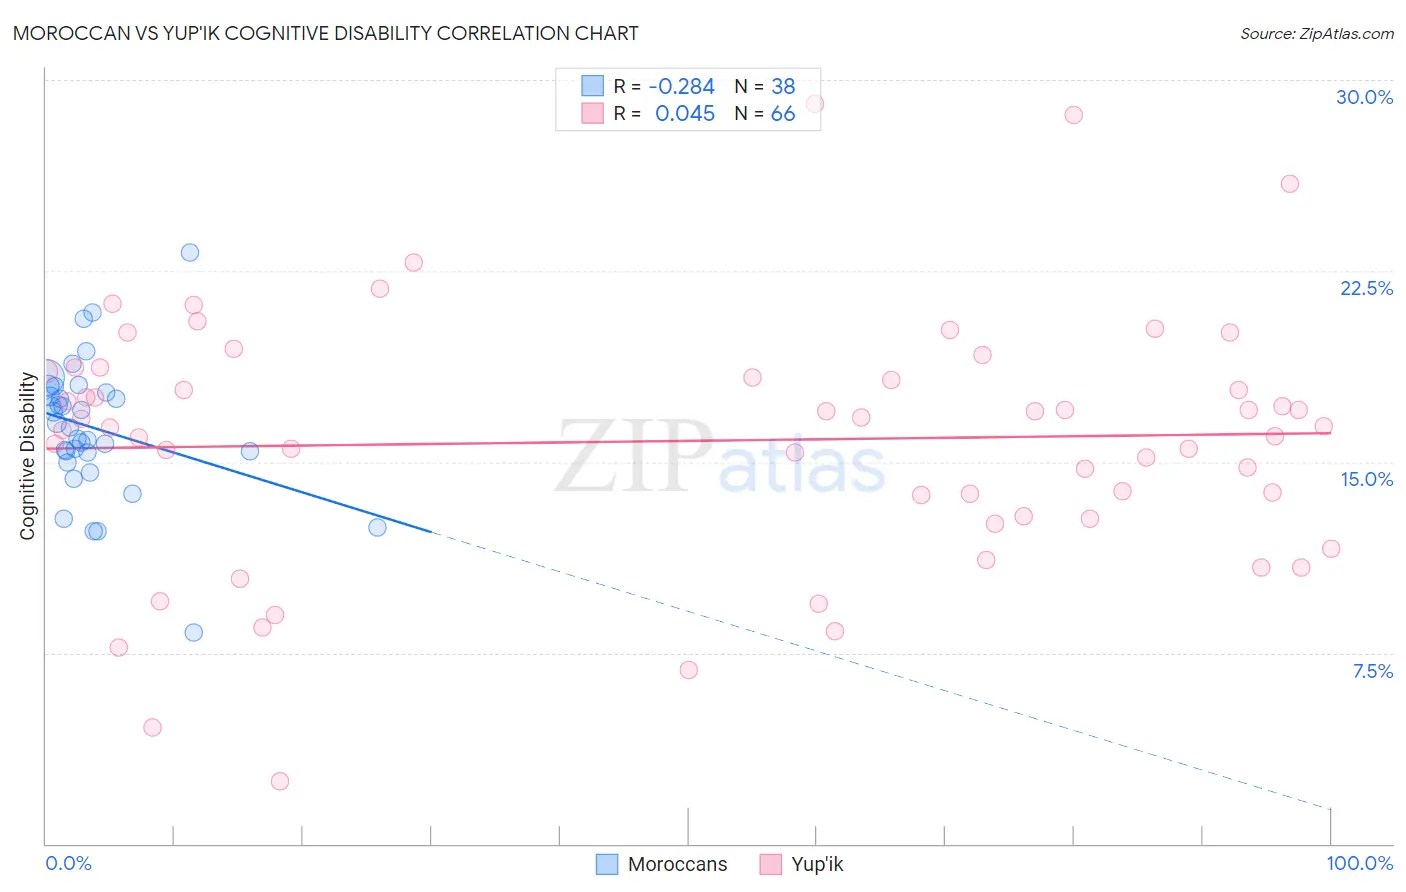
Moroccan vs Yup'ik Cognitive Disability Correlation Chart
The statistical analysis conducted on geographies consisting of 201,805,523 people shows a weak negative correlation between the proportion of Moroccans and percentage of population with cognitive disability in the United States with a correlation coefficient (R) of -0.284 and weighted average of 17.6%. Similarly, the statistical analysis conducted on geographies consisting of 39,961,414 people shows no correlation between the proportion of Yup'ik and percentage of population with cognitive disability in the United States with a correlation coefficient (R) of 0.045 and weighted average of 16.9%, a difference of 4.5%.
Cognitive Disability Correlation Summary
| Measurement | Moroccan | Yup'ik |
| Minimum | 8.3% | 2.5% |
| Maximum | 23.2% | 29.1% |
| Range | 15.0% | 26.6% |
| Mean | 16.3% | 15.8% |
| Median | 16.4% | 16.4% |
| Interquartile 25% (IQ1) | 15.4% | 12.9% |
| Interquartile 75% (IQ3) | 17.7% | 18.5% |
| Interquartile Range (IQR) | 2.3% | 5.7% |
| Standard Deviation (Sample) | 2.7% | 5.0% |
| Standard Deviation (Population) | 2.7% | 5.0% |
Similar Demographics by Cognitive Disability
Demographics Similar to Moroccans by Cognitive Disability
In terms of cognitive disability, the demographic groups most similar to Moroccans are Zimbabwean (17.6%, a difference of 0.020%), Icelander (17.6%, a difference of 0.050%), Immigrants from Sierra Leone (17.6%, a difference of 0.050%), Salvadoran (17.6%, a difference of 0.090%), and Okinawan (17.6%, a difference of 0.10%).
| Demographics | Rating | Rank | Cognitive Disability |
| Immigrants | El Salvador | 7.0 /100 | #214 | Tragic 17.6% |
| Alaskan Athabascans | 6.9 /100 | #215 | Tragic 17.6% |
| Okinawans | 6.8 /100 | #216 | Tragic 17.6% |
| Salvadorans | 6.7 /100 | #217 | Tragic 17.6% |
| Icelanders | 6.4 /100 | #218 | Tragic 17.6% |
| Immigrants | Sierra Leone | 6.3 /100 | #219 | Tragic 17.6% |
| Zimbabweans | 6.1 /100 | #220 | Tragic 17.6% |
| Moroccans | 5.9 /100 | #221 | Tragic 17.6% |
| Central Americans | 4.5 /100 | #222 | Tragic 17.7% |
| Alsatians | 4.5 /100 | #223 | Tragic 17.7% |
| Fijians | 3.4 /100 | #224 | Tragic 17.7% |
| Vietnamese | 3.4 /100 | #225 | Tragic 17.7% |
| Marshallese | 2.7 /100 | #226 | Tragic 17.7% |
| Immigrants | St. Vincent and the Grenadines | 2.6 /100 | #227 | Tragic 17.7% |
| Immigrants | Central America | 2.3 /100 | #228 | Tragic 17.7% |
Demographics Similar to Yup'ik by Cognitive Disability
In terms of cognitive disability, the demographic groups most similar to Yup'ik are Korean (16.8%, a difference of 0.050%), Indian (Asian) (16.8%, a difference of 0.060%), Immigrants from Sri Lanka (16.8%, a difference of 0.060%), Uruguayan (16.8%, a difference of 0.080%), and Arapaho (16.8%, a difference of 0.090%).
| Demographics | Rating | Rank | Cognitive Disability |
| Canadians | 97.5 /100 | #108 | Exceptional 16.8% |
| Albanians | 97.3 /100 | #109 | Exceptional 16.8% |
| Arapaho | 97.3 /100 | #110 | Exceptional 16.8% |
| Uruguayans | 97.2 /100 | #111 | Exceptional 16.8% |
| Indians (Asian) | 97.2 /100 | #112 | Exceptional 16.8% |
| Immigrants | Sri Lanka | 97.1 /100 | #113 | Exceptional 16.8% |
| Koreans | 97.1 /100 | #114 | Exceptional 16.8% |
| Yup'ik | 96.9 /100 | #115 | Exceptional 16.9% |
| Inupiat | 96.5 /100 | #116 | Exceptional 16.9% |
| Immigrants | Japan | 96.2 /100 | #117 | Exceptional 16.9% |
| Immigrants | Denmark | 96.2 /100 | #118 | Exceptional 16.9% |
| South Africans | 95.5 /100 | #119 | Exceptional 16.9% |
| Scottish | 95.0 /100 | #120 | Exceptional 16.9% |
| Immigrants | China | 94.9 /100 | #121 | Exceptional 16.9% |
| Immigrants | Western Europe | 94.8 /100 | #122 | Exceptional 16.9% |