Iranian vs Venezuelan Ambulatory Disability
COMPARE
Iranian
Venezuelan
Ambulatory Disability
Ambulatory Disability Comparison
Iranians
Venezuelans
5.1%
AMBULATORY DISABILITY
100.0/ 100
METRIC RATING
9th/ 347
METRIC RANK
5.5%
AMBULATORY DISABILITY
99.9/ 100
METRIC RATING
40th/ 347
METRIC RANK
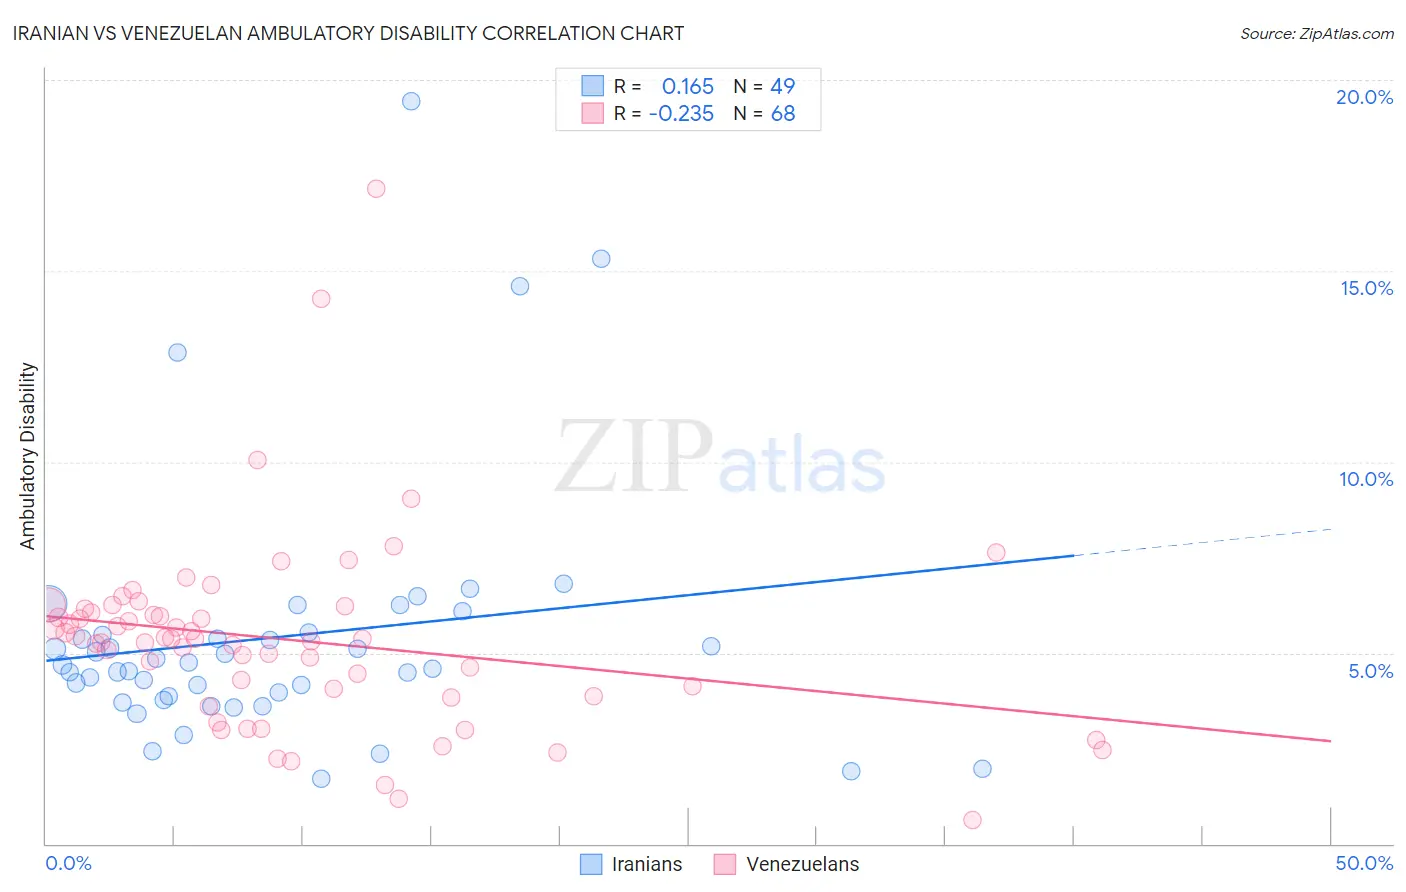
Iranian vs Venezuelan Ambulatory Disability Correlation Chart
The statistical analysis conducted on geographies consisting of 316,801,609 people shows a poor positive correlation between the proportion of Iranians and percentage of population with ambulatory disability in the United States with a correlation coefficient (R) of 0.165 and weighted average of 5.1%. Similarly, the statistical analysis conducted on geographies consisting of 306,237,534 people shows a weak negative correlation between the proportion of Venezuelans and percentage of population with ambulatory disability in the United States with a correlation coefficient (R) of -0.235 and weighted average of 5.5%, a difference of 7.3%.
Ambulatory Disability Correlation Summary
| Measurement | Iranian | Venezuelan |
| Minimum | 1.7% | 0.63% |
| Maximum | 19.5% | 17.1% |
| Range | 17.7% | 16.5% |
| Mean | 5.4% | 5.3% |
| Median | 4.7% | 5.4% |
| Interquartile 25% (IQ1) | 3.8% | 4.0% |
| Interquartile 75% (IQ3) | 5.5% | 6.1% |
| Interquartile Range (IQR) | 1.7% | 2.1% |
| Standard Deviation (Sample) | 3.4% | 2.6% |
| Standard Deviation (Population) | 3.3% | 2.5% |
Similar Demographics by Ambulatory Disability
Demographics Similar to Iranians by Ambulatory Disability
In terms of ambulatory disability, the demographic groups most similar to Iranians are Immigrants from South Central Asia (5.1%, a difference of 0.36%), Yup'ik (5.2%, a difference of 0.60%), Bolivian (5.1%, a difference of 1.4%), Immigrants from Bolivia (5.0%, a difference of 1.7%), and Immigrants from Korea (5.2%, a difference of 2.2%).
| Demographics | Rating | Rank | Ambulatory Disability |
| Filipinos | 100.0 /100 | #2 | Exceptional 4.9% |
| Thais | 100.0 /100 | #3 | Exceptional 4.9% |
| Immigrants | Taiwan | 100.0 /100 | #4 | Exceptional 4.9% |
| Immigrants | Singapore | 100.0 /100 | #5 | Exceptional 5.0% |
| Immigrants | Bolivia | 100.0 /100 | #6 | Exceptional 5.0% |
| Bolivians | 100.0 /100 | #7 | Exceptional 5.1% |
| Immigrants | South Central Asia | 100.0 /100 | #8 | Exceptional 5.1% |
| Iranians | 100.0 /100 | #9 | Exceptional 5.1% |
| Yup'ik | 100.0 /100 | #10 | Exceptional 5.2% |
| Immigrants | Korea | 100.0 /100 | #11 | Exceptional 5.2% |
| Okinawans | 100.0 /100 | #12 | Exceptional 5.3% |
| Burmese | 100.0 /100 | #13 | Exceptional 5.3% |
| Immigrants | Eastern Asia | 100.0 /100 | #14 | Exceptional 5.3% |
| Immigrants | China | 100.0 /100 | #15 | Exceptional 5.3% |
| Immigrants | Hong Kong | 100.0 /100 | #16 | Exceptional 5.3% |
Demographics Similar to Venezuelans by Ambulatory Disability
In terms of ambulatory disability, the demographic groups most similar to Venezuelans are Mongolian (5.5%, a difference of 0.080%), Argentinean (5.5%, a difference of 0.16%), Immigrants from Eritrea (5.5%, a difference of 0.34%), Turkish (5.5%, a difference of 0.43%), and Cypriot (5.5%, a difference of 0.43%).
| Demographics | Rating | Rank | Ambulatory Disability |
| Immigrants | Pakistan | 100.0 /100 | #33 | Exceptional 5.5% |
| Immigrants | Asia | 100.0 /100 | #34 | Exceptional 5.5% |
| Afghans | 100.0 /100 | #35 | Exceptional 5.5% |
| Immigrants | Malaysia | 100.0 /100 | #36 | Exceptional 5.5% |
| Turks | 100.0 /100 | #37 | Exceptional 5.5% |
| Cypriots | 100.0 /100 | #38 | Exceptional 5.5% |
| Immigrants | Eritrea | 100.0 /100 | #39 | Exceptional 5.5% |
| Venezuelans | 99.9 /100 | #40 | Exceptional 5.5% |
| Mongolians | 99.9 /100 | #41 | Exceptional 5.5% |
| Argentineans | 99.9 /100 | #42 | Exceptional 5.5% |
| Paraguayans | 99.9 /100 | #43 | Exceptional 5.5% |
| Immigrants | Indonesia | 99.9 /100 | #44 | Exceptional 5.5% |
| Immigrants | Sweden | 99.9 /100 | #45 | Exceptional 5.6% |
| Egyptians | 99.9 /100 | #46 | Exceptional 5.6% |
| Immigrants | Japan | 99.9 /100 | #47 | Exceptional 5.6% |