Iranian vs Pennsylvania German Ambulatory Disability
COMPARE
Iranian
Pennsylvania German
Ambulatory Disability
Ambulatory Disability Comparison
Iranians
Pennsylvania Germans
5.1%
AMBULATORY DISABILITY
100.0/ 100
METRIC RATING
9th/ 347
METRIC RANK
6.8%
AMBULATORY DISABILITY
0.0/ 100
METRIC RATING
280th/ 347
METRIC RANK
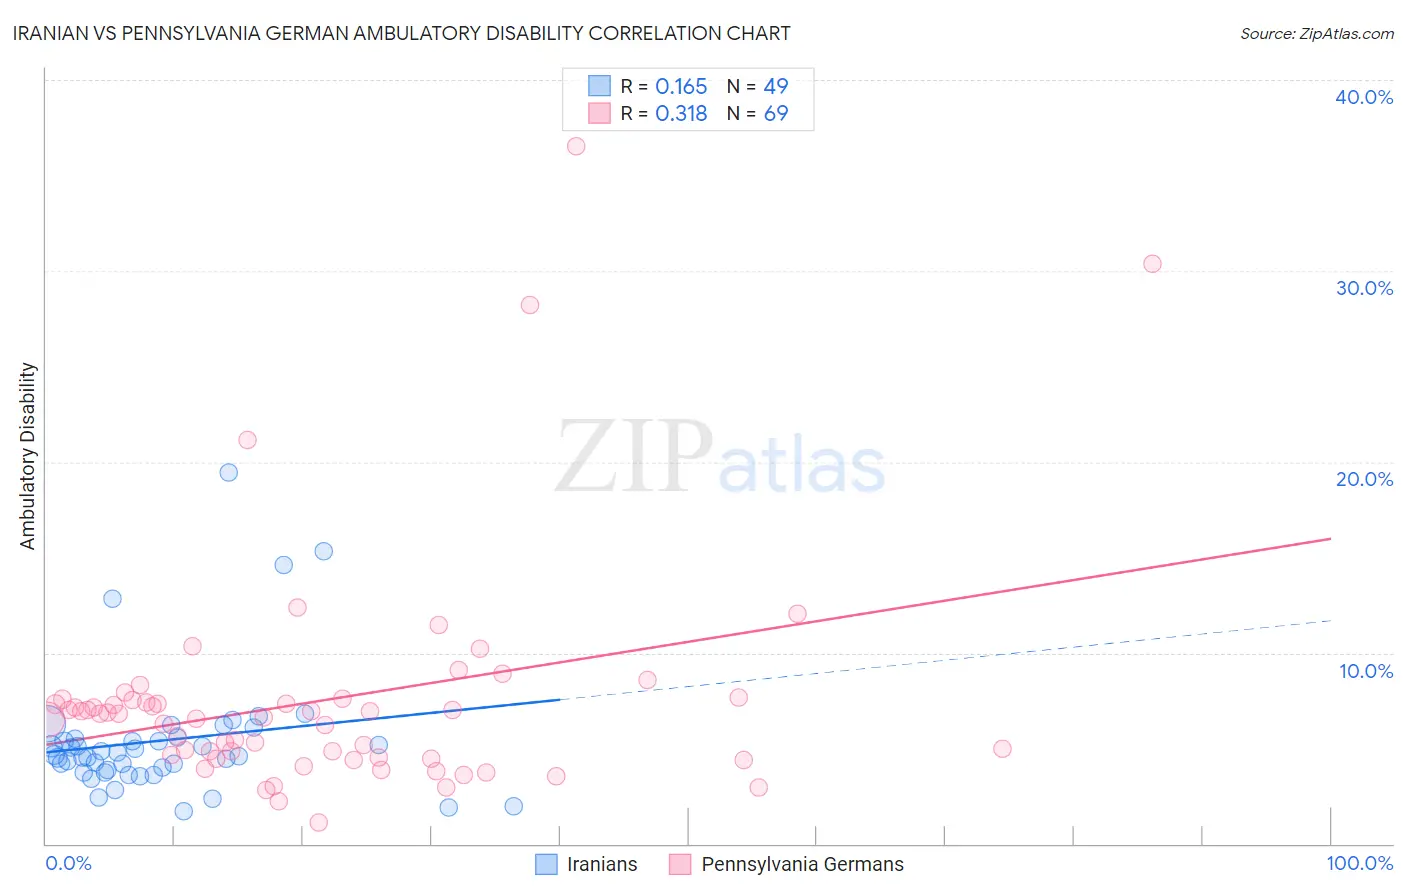
Iranian vs Pennsylvania German Ambulatory Disability Correlation Chart
The statistical analysis conducted on geographies consisting of 316,801,609 people shows a poor positive correlation between the proportion of Iranians and percentage of population with ambulatory disability in the United States with a correlation coefficient (R) of 0.165 and weighted average of 5.1%. Similarly, the statistical analysis conducted on geographies consisting of 234,073,505 people shows a mild positive correlation between the proportion of Pennsylvania Germans and percentage of population with ambulatory disability in the United States with a correlation coefficient (R) of 0.318 and weighted average of 6.8%, a difference of 31.7%.
Ambulatory Disability Correlation Summary
| Measurement | Iranian | Pennsylvania German |
| Minimum | 1.7% | 1.1% |
| Maximum | 19.5% | 36.5% |
| Range | 17.7% | 35.4% |
| Mean | 5.4% | 7.5% |
| Median | 4.7% | 6.8% |
| Interquartile 25% (IQ1) | 3.8% | 4.5% |
| Interquartile 75% (IQ3) | 5.5% | 7.5% |
| Interquartile Range (IQR) | 1.7% | 3.1% |
| Standard Deviation (Sample) | 3.4% | 6.0% |
| Standard Deviation (Population) | 3.3% | 5.9% |
Similar Demographics by Ambulatory Disability
Demographics Similar to Iranians by Ambulatory Disability
In terms of ambulatory disability, the demographic groups most similar to Iranians are Immigrants from South Central Asia (5.1%, a difference of 0.36%), Yup'ik (5.2%, a difference of 0.60%), Bolivian (5.1%, a difference of 1.4%), Immigrants from Bolivia (5.0%, a difference of 1.7%), and Immigrants from Korea (5.2%, a difference of 2.2%).
| Demographics | Rating | Rank | Ambulatory Disability |
| Filipinos | 100.0 /100 | #2 | Exceptional 4.9% |
| Thais | 100.0 /100 | #3 | Exceptional 4.9% |
| Immigrants | Taiwan | 100.0 /100 | #4 | Exceptional 4.9% |
| Immigrants | Singapore | 100.0 /100 | #5 | Exceptional 5.0% |
| Immigrants | Bolivia | 100.0 /100 | #6 | Exceptional 5.0% |
| Bolivians | 100.0 /100 | #7 | Exceptional 5.1% |
| Immigrants | South Central Asia | 100.0 /100 | #8 | Exceptional 5.1% |
| Iranians | 100.0 /100 | #9 | Exceptional 5.1% |
| Yup'ik | 100.0 /100 | #10 | Exceptional 5.2% |
| Immigrants | Korea | 100.0 /100 | #11 | Exceptional 5.2% |
| Okinawans | 100.0 /100 | #12 | Exceptional 5.3% |
| Burmese | 100.0 /100 | #13 | Exceptional 5.3% |
| Immigrants | Eastern Asia | 100.0 /100 | #14 | Exceptional 5.3% |
| Immigrants | China | 100.0 /100 | #15 | Exceptional 5.3% |
| Immigrants | Hong Kong | 100.0 /100 | #16 | Exceptional 5.3% |
Demographics Similar to Pennsylvania Germans by Ambulatory Disability
In terms of ambulatory disability, the demographic groups most similar to Pennsylvania Germans are Yaqui (6.8%, a difference of 0.070%), Immigrants from Caribbean (6.7%, a difference of 0.10%), Barbadian (6.8%, a difference of 0.20%), Immigrants from Barbados (6.8%, a difference of 0.36%), and Immigrants from West Indies (6.7%, a difference of 0.41%).
| Demographics | Rating | Rank | Ambulatory Disability |
| Whites/Caucasians | 0.1 /100 | #273 | Tragic 6.7% |
| Sioux | 0.1 /100 | #274 | Tragic 6.7% |
| Immigrants | Guyana | 0.1 /100 | #275 | Tragic 6.7% |
| Celtics | 0.1 /100 | #276 | Tragic 6.7% |
| Jamaicans | 0.1 /100 | #277 | Tragic 6.7% |
| Immigrants | West Indies | 0.1 /100 | #278 | Tragic 6.7% |
| Immigrants | Caribbean | 0.0 /100 | #279 | Tragic 6.7% |
| Pennsylvania Germans | 0.0 /100 | #280 | Tragic 6.8% |
| Yaqui | 0.0 /100 | #281 | Tragic 6.8% |
| Barbadians | 0.0 /100 | #282 | Tragic 6.8% |
| Immigrants | Barbados | 0.0 /100 | #283 | Tragic 6.8% |
| Immigrants | Jamaica | 0.0 /100 | #284 | Tragic 6.8% |
| Fijians | 0.0 /100 | #285 | Tragic 6.8% |
| Yakama | 0.0 /100 | #286 | Tragic 6.8% |
| U.S. Virgin Islanders | 0.0 /100 | #287 | Tragic 6.8% |