Iranian vs Immigrants from Ireland Male Disability
COMPARE
Iranian
Immigrants from Ireland
Male Disability
Male Disability Comparison
Iranians
Immigrants from Ireland
9.7%
MALE DISABILITY
100.0/ 100
METRIC RATING
13th/ 347
METRIC RANK
10.6%
MALE DISABILITY
97.9/ 100
METRIC RATING
86th/ 347
METRIC RANK
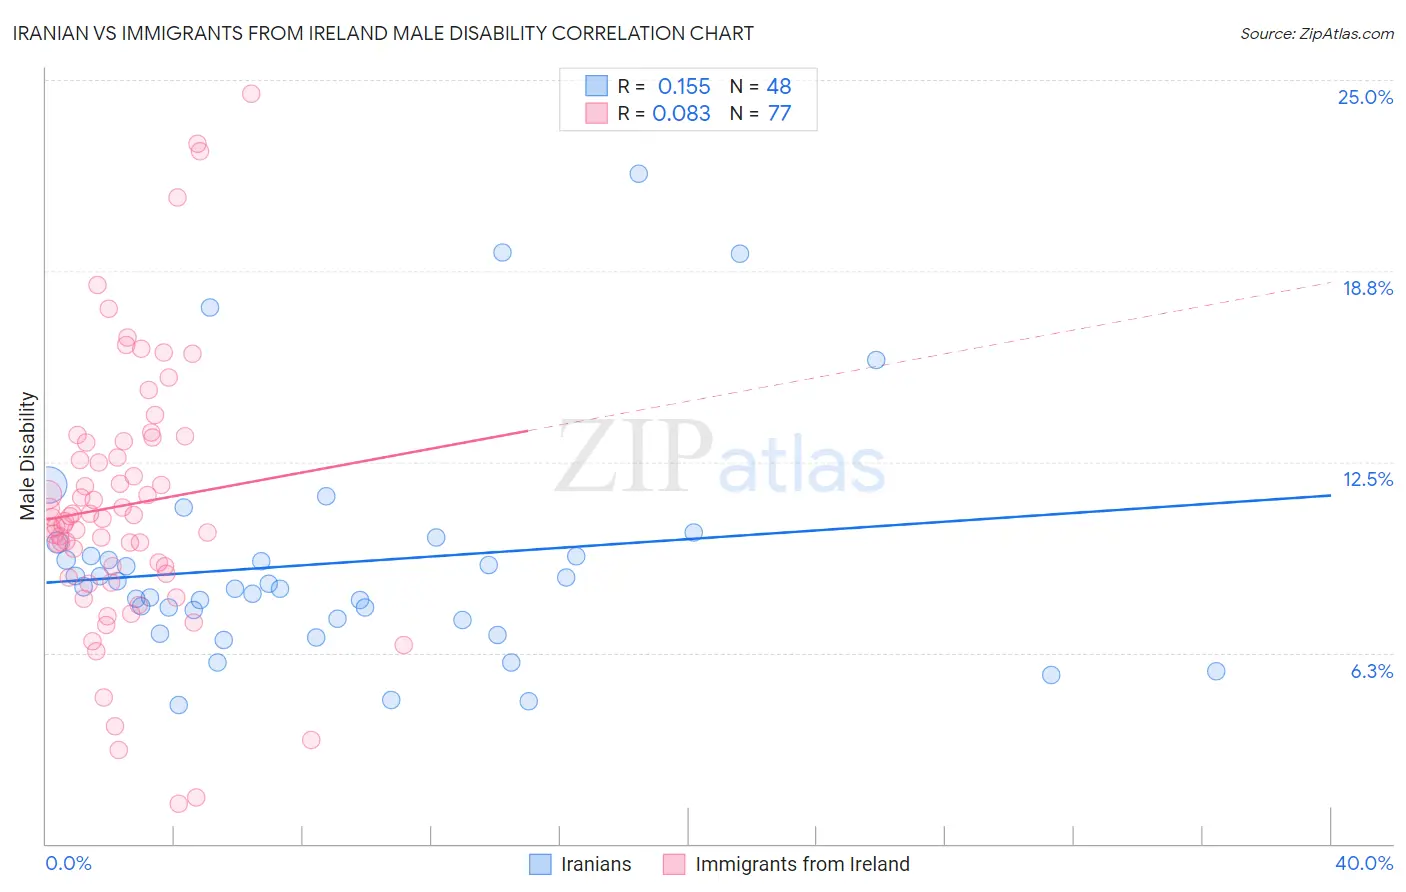
Iranian vs Immigrants from Ireland Male Disability Correlation Chart
The statistical analysis conducted on geographies consisting of 316,851,194 people shows a poor positive correlation between the proportion of Iranians and percentage of males with a disability in the United States with a correlation coefficient (R) of 0.155 and weighted average of 9.7%. Similarly, the statistical analysis conducted on geographies consisting of 240,771,844 people shows a slight positive correlation between the proportion of Immigrants from Ireland and percentage of males with a disability in the United States with a correlation coefficient (R) of 0.083 and weighted average of 10.6%, a difference of 9.9%.
Male Disability Correlation Summary
| Measurement | Iranian | Immigrants from Ireland |
| Minimum | 4.5% | 1.3% |
| Maximum | 21.9% | 24.5% |
| Range | 17.4% | 23.2% |
| Mean | 9.2% | 11.1% |
| Median | 8.4% | 10.6% |
| Interquartile 25% (IQ1) | 7.4% | 8.8% |
| Interquartile 75% (IQ3) | 9.4% | 13.2% |
| Interquartile Range (IQR) | 2.1% | 4.4% |
| Standard Deviation (Sample) | 3.7% | 4.4% |
| Standard Deviation (Population) | 3.7% | 4.4% |
Similar Demographics by Male Disability
Demographics Similar to Iranians by Male Disability
In terms of male disability, the demographic groups most similar to Iranians are Immigrants from Iran (9.7%, a difference of 0.10%), Bolivian (9.6%, a difference of 0.23%), Immigrants from Eastern Asia (9.6%, a difference of 0.46%), Indian (Asian) (9.7%, a difference of 0.55%), and Immigrants from Israel (9.6%, a difference of 1.0%).
| Demographics | Rating | Rank | Male Disability |
| Immigrants | South Central Asia | 100.0 /100 | #6 | Exceptional 9.4% |
| Immigrants | Bolivia | 100.0 /100 | #7 | Exceptional 9.5% |
| Immigrants | China | 100.0 /100 | #8 | Exceptional 9.5% |
| Immigrants | Singapore | 100.0 /100 | #9 | Exceptional 9.5% |
| Immigrants | Israel | 100.0 /100 | #10 | Exceptional 9.6% |
| Immigrants | Eastern Asia | 100.0 /100 | #11 | Exceptional 9.6% |
| Bolivians | 100.0 /100 | #12 | Exceptional 9.6% |
| Iranians | 100.0 /100 | #13 | Exceptional 9.7% |
| Immigrants | Iran | 100.0 /100 | #14 | Exceptional 9.7% |
| Indians (Asian) | 100.0 /100 | #15 | Exceptional 9.7% |
| Okinawans | 100.0 /100 | #16 | Exceptional 9.8% |
| Immigrants | Korea | 100.0 /100 | #17 | Exceptional 9.8% |
| Immigrants | Pakistan | 100.0 /100 | #18 | Exceptional 9.8% |
| Immigrants | Sri Lanka | 100.0 /100 | #19 | Exceptional 10.0% |
| Asians | 100.0 /100 | #20 | Exceptional 10.0% |
Demographics Similar to Immigrants from Ireland by Male Disability
In terms of male disability, the demographic groups most similar to Immigrants from Ireland are Sri Lankan (10.6%, a difference of 0.010%), Immigrants from Vietnam (10.6%, a difference of 0.020%), Immigrants from Western Asia (10.6%, a difference of 0.090%), Immigrants from Nicaragua (10.6%, a difference of 0.090%), and Immigrants from Morocco (10.6%, a difference of 0.14%).
| Demographics | Rating | Rank | Male Disability |
| Zimbabweans | 98.4 /100 | #79 | Exceptional 10.6% |
| Immigrants | Jordan | 98.4 /100 | #80 | Exceptional 10.6% |
| Immigrants | Chile | 98.3 /100 | #81 | Exceptional 10.6% |
| Immigrants | Guyana | 98.2 /100 | #82 | Exceptional 10.6% |
| Immigrants | Poland | 98.1 /100 | #83 | Exceptional 10.6% |
| Bulgarians | 98.1 /100 | #84 | Exceptional 10.6% |
| Sri Lankans | 97.9 /100 | #85 | Exceptional 10.6% |
| Immigrants | Ireland | 97.9 /100 | #86 | Exceptional 10.6% |
| Immigrants | Vietnam | 97.9 /100 | #87 | Exceptional 10.6% |
| Immigrants | Western Asia | 97.8 /100 | #88 | Exceptional 10.6% |
| Immigrants | Nicaragua | 97.8 /100 | #89 | Exceptional 10.6% |
| Immigrants | Morocco | 97.7 /100 | #90 | Exceptional 10.6% |
| Immigrants | France | 97.6 /100 | #91 | Exceptional 10.6% |
| Palestinians | 97.4 /100 | #92 | Exceptional 10.7% |
| Immigrants | St. Vincent and the Grenadines | 97.1 /100 | #93 | Exceptional 10.7% |