Iranian vs Navajo Male Disability
COMPARE
Iranian
Navajo
Male Disability
Male Disability Comparison
Iranians
Navajo
9.7%
MALE DISABILITY
100.0/ 100
METRIC RATING
13th/ 347
METRIC RANK
14.4%
MALE DISABILITY
0.0/ 100
METRIC RATING
330th/ 347
METRIC RANK
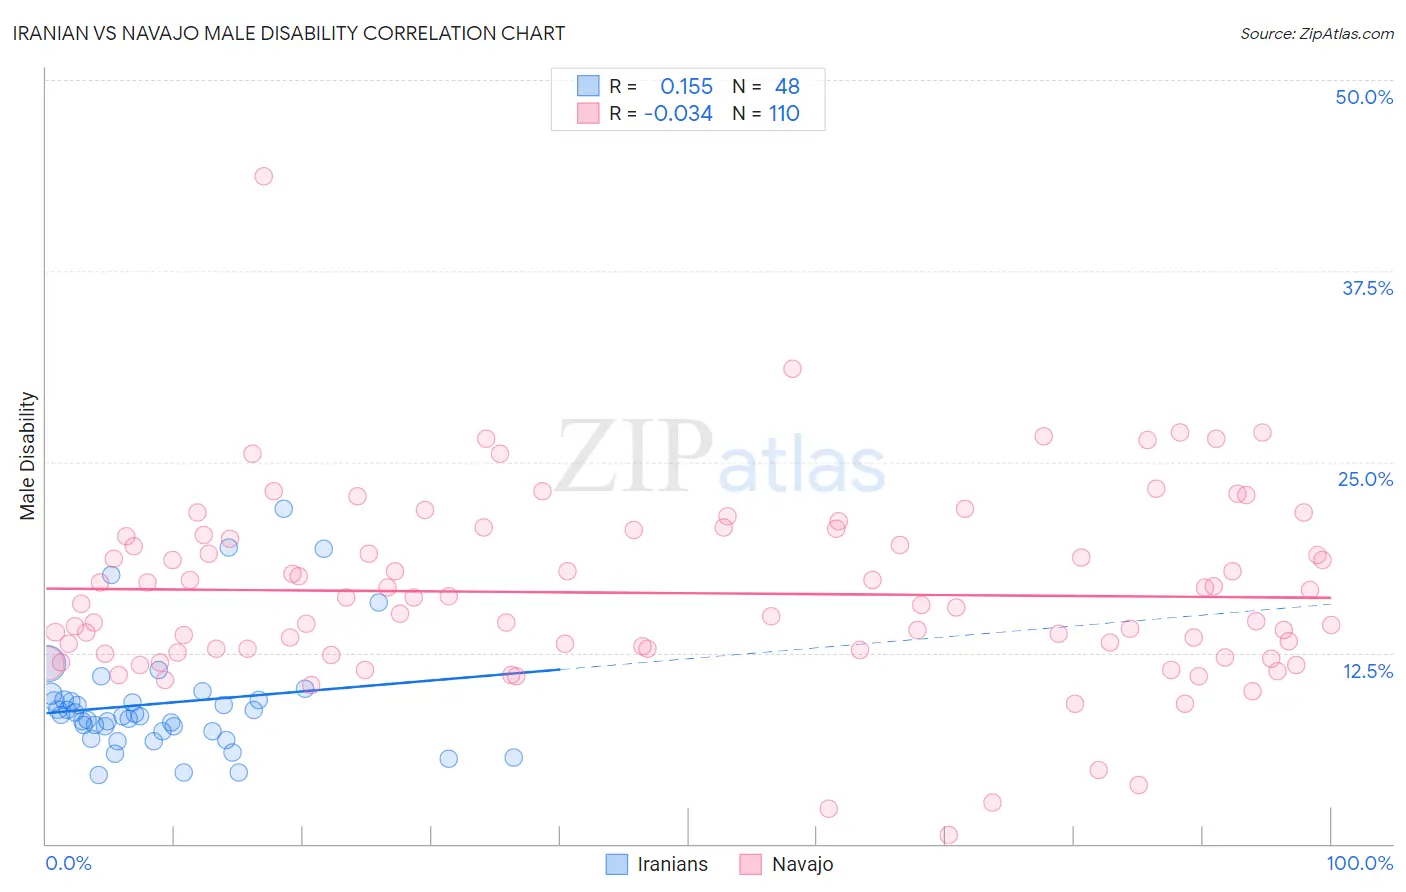
Iranian vs Navajo Male Disability Correlation Chart
The statistical analysis conducted on geographies consisting of 316,851,194 people shows a poor positive correlation between the proportion of Iranians and percentage of males with a disability in the United States with a correlation coefficient (R) of 0.155 and weighted average of 9.7%. Similarly, the statistical analysis conducted on geographies consisting of 224,784,363 people shows no correlation between the proportion of Navajo and percentage of males with a disability in the United States with a correlation coefficient (R) of -0.034 and weighted average of 14.4%, a difference of 49.0%.
Male Disability Correlation Summary
| Measurement | Iranian | Navajo |
| Minimum | 4.5% | 0.60% |
| Maximum | 21.9% | 43.7% |
| Range | 17.4% | 43.1% |
| Mean | 9.2% | 16.4% |
| Median | 8.4% | 15.6% |
| Interquartile 25% (IQ1) | 7.4% | 12.7% |
| Interquartile 75% (IQ3) | 9.4% | 20.1% |
| Interquartile Range (IQR) | 2.1% | 7.5% |
| Standard Deviation (Sample) | 3.7% | 6.1% |
| Standard Deviation (Population) | 3.7% | 6.1% |
Similar Demographics by Male Disability
Demographics Similar to Iranians by Male Disability
In terms of male disability, the demographic groups most similar to Iranians are Immigrants from Iran (9.7%, a difference of 0.10%), Bolivian (9.6%, a difference of 0.23%), Immigrants from Eastern Asia (9.6%, a difference of 0.46%), Indian (Asian) (9.7%, a difference of 0.55%), and Immigrants from Israel (9.6%, a difference of 1.0%).
| Demographics | Rating | Rank | Male Disability |
| Immigrants | South Central Asia | 100.0 /100 | #6 | Exceptional 9.4% |
| Immigrants | Bolivia | 100.0 /100 | #7 | Exceptional 9.5% |
| Immigrants | China | 100.0 /100 | #8 | Exceptional 9.5% |
| Immigrants | Singapore | 100.0 /100 | #9 | Exceptional 9.5% |
| Immigrants | Israel | 100.0 /100 | #10 | Exceptional 9.6% |
| Immigrants | Eastern Asia | 100.0 /100 | #11 | Exceptional 9.6% |
| Bolivians | 100.0 /100 | #12 | Exceptional 9.6% |
| Iranians | 100.0 /100 | #13 | Exceptional 9.7% |
| Immigrants | Iran | 100.0 /100 | #14 | Exceptional 9.7% |
| Indians (Asian) | 100.0 /100 | #15 | Exceptional 9.7% |
| Okinawans | 100.0 /100 | #16 | Exceptional 9.8% |
| Immigrants | Korea | 100.0 /100 | #17 | Exceptional 9.8% |
| Immigrants | Pakistan | 100.0 /100 | #18 | Exceptional 9.8% |
| Immigrants | Sri Lanka | 100.0 /100 | #19 | Exceptional 10.0% |
| Asians | 100.0 /100 | #20 | Exceptional 10.0% |
Demographics Similar to Navajo by Male Disability
In terms of male disability, the demographic groups most similar to Navajo are Cajun (14.4%, a difference of 0.23%), Chippewa (14.3%, a difference of 0.81%), Potawatomi (14.2%, a difference of 1.2%), Native/Alaskan (14.2%, a difference of 1.3%), and Tohono O'odham (14.6%, a difference of 1.5%).
| Demographics | Rating | Rank | Male Disability |
| Osage | 0.0 /100 | #323 | Tragic 14.0% |
| Comanche | 0.0 /100 | #324 | Tragic 14.1% |
| Ottawa | 0.0 /100 | #325 | Tragic 14.1% |
| Natives/Alaskans | 0.0 /100 | #326 | Tragic 14.2% |
| Potawatomi | 0.0 /100 | #327 | Tragic 14.2% |
| Chippewa | 0.0 /100 | #328 | Tragic 14.3% |
| Cajuns | 0.0 /100 | #329 | Tragic 14.4% |
| Navajo | 0.0 /100 | #330 | Tragic 14.4% |
| Tohono O'odham | 0.0 /100 | #331 | Tragic 14.6% |
| Seminole | 0.0 /100 | #332 | Tragic 14.7% |
| Yuman | 0.0 /100 | #333 | Tragic 14.7% |
| Cherokee | 0.0 /100 | #334 | Tragic 14.8% |
| Dutch West Indians | 0.0 /100 | #335 | Tragic 14.8% |
| Alaskan Athabascans | 0.0 /100 | #336 | Tragic 14.9% |
| Menominee | 0.0 /100 | #337 | Tragic 15.0% |