Inupiat vs Immigrants from Uganda Disability Age 65 to 74
COMPARE
Inupiat
Immigrants from Uganda
Disability Age 65 to 74
Disability Age 65 to 74 Comparison
Inupiat
Immigrants from Uganda
34.5%
DISABILITY AGE 65 TO 74
0.0/ 100
METRIC RATING
344th/ 347
METRIC RANK
22.8%
DISABILITY AGE 65 TO 74
84.0/ 100
METRIC RATING
145th/ 347
METRIC RANK
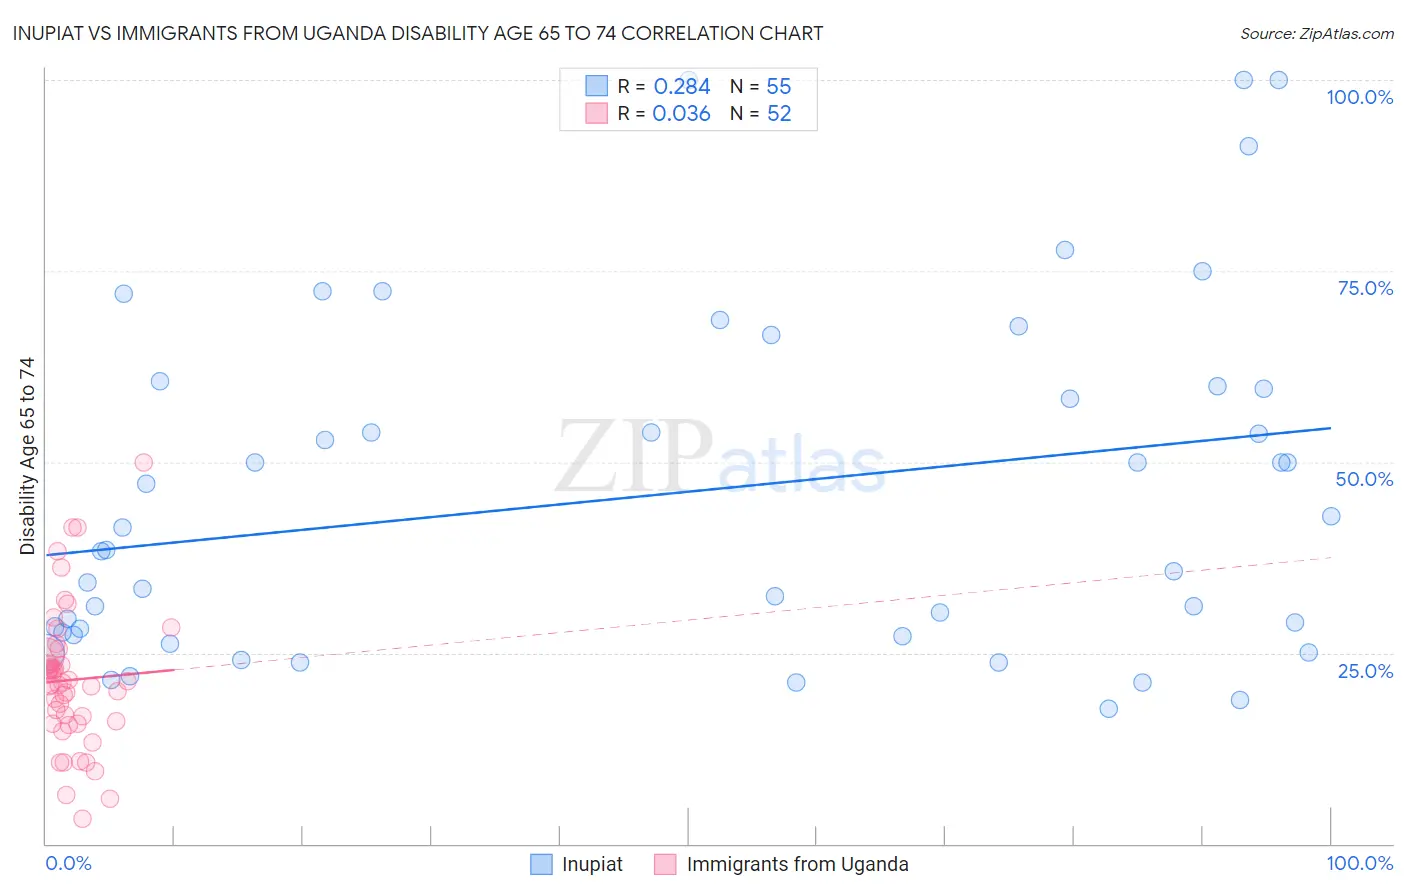
Inupiat vs Immigrants from Uganda Disability Age 65 to 74 Correlation Chart
The statistical analysis conducted on geographies consisting of 96,264,224 people shows a weak positive correlation between the proportion of Inupiat and percentage of population with a disability between the ages 65 and 75 in the United States with a correlation coefficient (R) of 0.284 and weighted average of 34.5%. Similarly, the statistical analysis conducted on geographies consisting of 125,925,118 people shows no correlation between the proportion of Immigrants from Uganda and percentage of population with a disability between the ages 65 and 75 in the United States with a correlation coefficient (R) of 0.036 and weighted average of 22.8%, a difference of 51.6%.
Disability Age 65 to 74 Correlation Summary
| Measurement | Inupiat | Immigrants from Uganda |
| Minimum | 17.6% | 3.2% |
| Maximum | 100.0% | 50.0% |
| Range | 82.4% | 46.8% |
| Mean | 45.8% | 21.4% |
| Median | 38.4% | 21.0% |
| Interquartile 25% (IQ1) | 27.4% | 15.9% |
| Interquartile 75% (IQ3) | 60.0% | 24.1% |
| Interquartile Range (IQR) | 32.6% | 8.2% |
| Standard Deviation (Sample) | 22.6% | 9.2% |
| Standard Deviation (Population) | 22.4% | 9.1% |
Similar Demographics by Disability Age 65 to 74
Demographics Similar to Inupiat by Disability Age 65 to 74
In terms of disability age 65 to 74, the demographic groups most similar to Inupiat are Navajo (33.3%, a difference of 3.6%), Pueblo (33.1%, a difference of 4.3%), Tohono O'odham (36.0%, a difference of 4.3%), Tsimshian (32.9%, a difference of 5.0%), and Lumbee (32.7%, a difference of 5.5%).
| Demographics | Rating | Rank | Disability Age 65 to 74 |
| Colville | 0.0 /100 | #333 | Tragic 30.5% |
| Alaska Natives | 0.0 /100 | #334 | Tragic 30.6% |
| Cheyenne | 0.0 /100 | #335 | Tragic 31.1% |
| Yuman | 0.0 /100 | #336 | Tragic 31.5% |
| Houma | 0.0 /100 | #337 | Tragic 32.3% |
| Alaskan Athabascans | 0.0 /100 | #338 | Tragic 32.4% |
| Kiowa | 0.0 /100 | #339 | Tragic 32.6% |
| Lumbee | 0.0 /100 | #340 | Tragic 32.7% |
| Tsimshian | 0.0 /100 | #341 | Tragic 32.9% |
| Pueblo | 0.0 /100 | #342 | Tragic 33.1% |
| Navajo | 0.0 /100 | #343 | Tragic 33.3% |
| Inupiat | 0.0 /100 | #344 | Tragic 34.5% |
| Tohono O'odham | 0.0 /100 | #345 | Tragic 36.0% |
| Yup'ik | 0.0 /100 | #346 | Tragic 37.8% |
| Pima | 0.0 /100 | #347 | Tragic 38.6% |
Demographics Similar to Immigrants from Uganda by Disability Age 65 to 74
In terms of disability age 65 to 74, the demographic groups most similar to Immigrants from Uganda are Alsatian (22.8%, a difference of 0.030%), Danish (22.8%, a difference of 0.040%), Arab (22.8%, a difference of 0.080%), Immigrants from Uzbekistan (22.8%, a difference of 0.10%), and Belgian (22.7%, a difference of 0.15%).
| Demographics | Rating | Rank | Disability Age 65 to 74 |
| Immigrants | Moldova | 87.3 /100 | #138 | Excellent 22.7% |
| Immigrants | Syria | 85.8 /100 | #139 | Excellent 22.7% |
| Ugandans | 85.4 /100 | #140 | Excellent 22.7% |
| Belgians | 85.3 /100 | #141 | Excellent 22.7% |
| Immigrants | Ethiopia | 85.3 /100 | #142 | Excellent 22.7% |
| Arabs | 84.8 /100 | #143 | Excellent 22.8% |
| Danes | 84.4 /100 | #144 | Excellent 22.8% |
| Immigrants | Uganda | 84.0 /100 | #145 | Excellent 22.8% |
| Alsatians | 83.7 /100 | #146 | Excellent 22.8% |
| Immigrants | Uzbekistan | 83.1 /100 | #147 | Excellent 22.8% |
| New Zealanders | 79.9 /100 | #148 | Good 22.9% |
| Swiss | 79.7 /100 | #149 | Good 22.9% |
| Canadians | 77.7 /100 | #150 | Good 22.9% |
| Immigrants | Morocco | 77.6 /100 | #151 | Good 22.9% |
| Finns | 76.5 /100 | #152 | Good 22.9% |