Immigrants from Philippines vs Immigrants from Uganda Disability Age 65 to 74
COMPARE
Immigrants from Philippines
Immigrants from Uganda
Disability Age 65 to 74
Disability Age 65 to 74 Comparison
Immigrants from Philippines
Immigrants from Uganda
23.2%
DISABILITY AGE 65 TO 74
61.1/ 100
METRIC RATING
163rd/ 347
METRIC RANK
22.8%
DISABILITY AGE 65 TO 74
84.0/ 100
METRIC RATING
145th/ 347
METRIC RANK
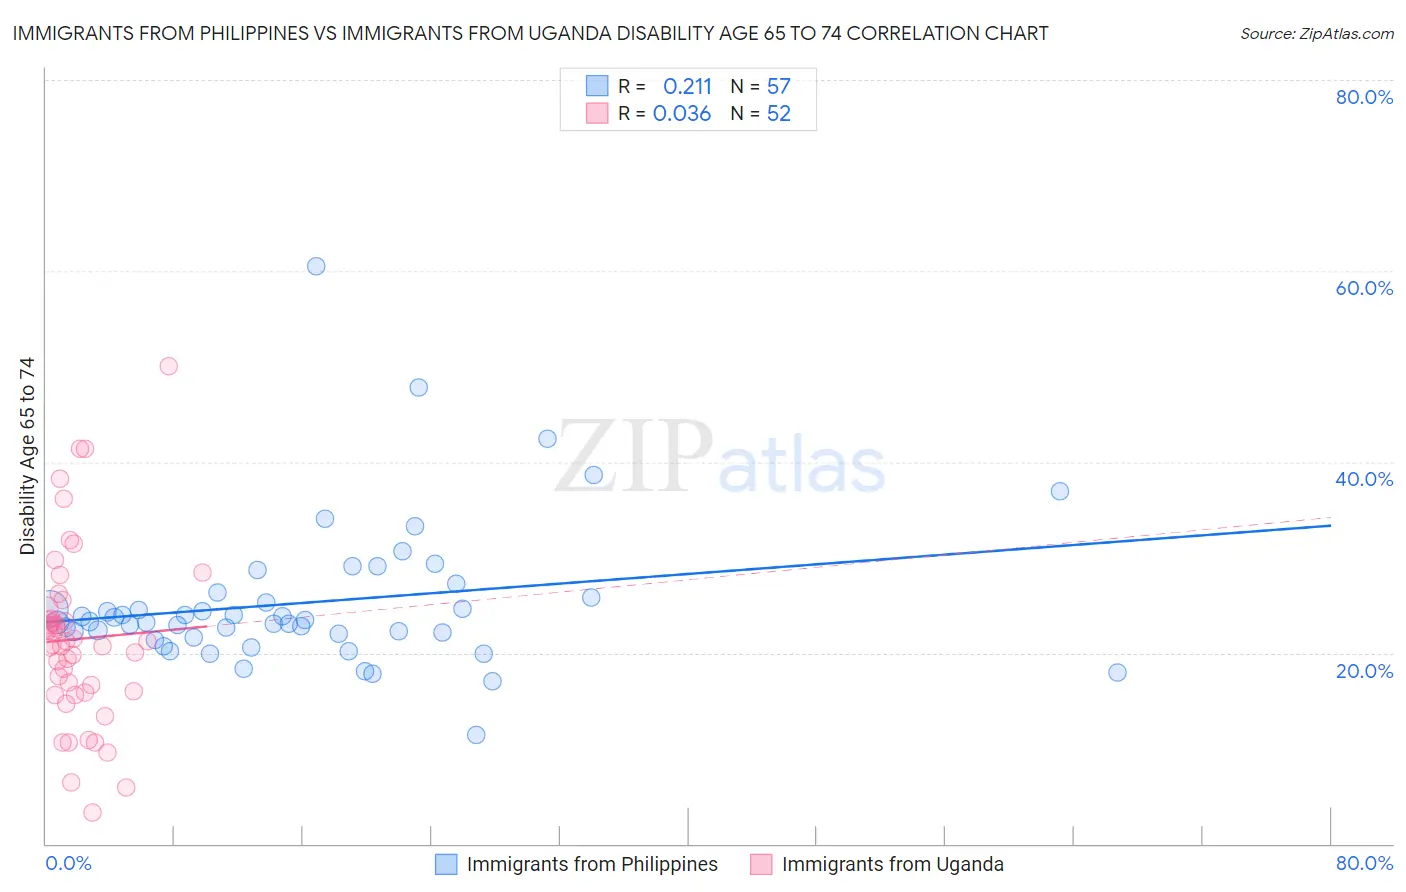
Immigrants from Philippines vs Immigrants from Uganda Disability Age 65 to 74 Correlation Chart
The statistical analysis conducted on geographies consisting of 470,156,643 people shows a weak positive correlation between the proportion of Immigrants from Philippines and percentage of population with a disability between the ages 65 and 75 in the United States with a correlation coefficient (R) of 0.211 and weighted average of 23.2%. Similarly, the statistical analysis conducted on geographies consisting of 125,925,118 people shows no correlation between the proportion of Immigrants from Uganda and percentage of population with a disability between the ages 65 and 75 in the United States with a correlation coefficient (R) of 0.036 and weighted average of 22.8%, a difference of 1.8%.
Disability Age 65 to 74 Correlation Summary
| Measurement | Immigrants from Philippines | Immigrants from Uganda |
| Minimum | 11.4% | 3.2% |
| Maximum | 60.5% | 50.0% |
| Range | 49.1% | 46.8% |
| Mean | 25.3% | 21.4% |
| Median | 23.3% | 21.0% |
| Interquartile 25% (IQ1) | 21.8% | 15.9% |
| Interquartile 75% (IQ3) | 26.1% | 24.1% |
| Interquartile Range (IQR) | 4.3% | 8.2% |
| Standard Deviation (Sample) | 7.7% | 9.2% |
| Standard Deviation (Population) | 7.7% | 9.1% |
Demographics Similar to Immigrants from Philippines and Immigrants from Uganda by Disability Age 65 to 74
In terms of disability age 65 to 74, the demographic groups most similar to Immigrants from Philippines are European (23.2%, a difference of 0.0%), Sierra Leonean (23.2%, a difference of 0.010%), Immigrants from Cameroon (23.1%, a difference of 0.16%), Korean (23.1%, a difference of 0.19%), and South American Indian (23.1%, a difference of 0.27%). Similarly, the demographic groups most similar to Immigrants from Uganda are Alsatian (22.8%, a difference of 0.030%), Danish (22.8%, a difference of 0.040%), Immigrants from Uzbekistan (22.8%, a difference of 0.10%), New Zealander (22.9%, a difference of 0.42%), and Swiss (22.9%, a difference of 0.44%).
| Demographics | Rating | Rank | Disability Age 65 to 74 |
| Danes | 84.4 /100 | #144 | Excellent 22.8% |
| Immigrants | Uganda | 84.0 /100 | #145 | Excellent 22.8% |
| Alsatians | 83.7 /100 | #146 | Excellent 22.8% |
| Immigrants | Uzbekistan | 83.1 /100 | #147 | Excellent 22.8% |
| New Zealanders | 79.9 /100 | #148 | Good 22.9% |
| Swiss | 79.7 /100 | #149 | Good 22.9% |
| Canadians | 77.7 /100 | #150 | Good 22.9% |
| Immigrants | Morocco | 77.6 /100 | #151 | Good 22.9% |
| Finns | 76.5 /100 | #152 | Good 22.9% |
| Slavs | 75.2 /100 | #153 | Good 23.0% |
| Sri Lankans | 74.0 /100 | #154 | Good 23.0% |
| British | 73.9 /100 | #155 | Good 23.0% |
| Immigrants | Western Asia | 73.8 /100 | #156 | Good 23.0% |
| Czechoslovakians | 72.4 /100 | #157 | Good 23.0% |
| Immigrants | Vietnam | 69.1 /100 | #158 | Good 23.1% |
| South American Indians | 65.5 /100 | #159 | Good 23.1% |
| Koreans | 64.2 /100 | #160 | Good 23.1% |
| Immigrants | Cameroon | 63.8 /100 | #161 | Good 23.1% |
| Europeans | 61.2 /100 | #162 | Good 23.2% |
| Immigrants | Philippines | 61.1 /100 | #163 | Good 23.2% |
| Sierra Leoneans | 60.9 /100 | #164 | Good 23.2% |