Immigrants from Cuba vs Immigrants from Uganda Disability Age 65 to 74
COMPARE
Immigrants from Cuba
Immigrants from Uganda
Disability Age 65 to 74
Disability Age 65 to 74 Comparison
Immigrants from Cuba
Immigrants from Uganda
23.6%
DISABILITY AGE 65 TO 74
34.0/ 100
METRIC RATING
188th/ 347
METRIC RANK
22.8%
DISABILITY AGE 65 TO 74
84.0/ 100
METRIC RATING
145th/ 347
METRIC RANK
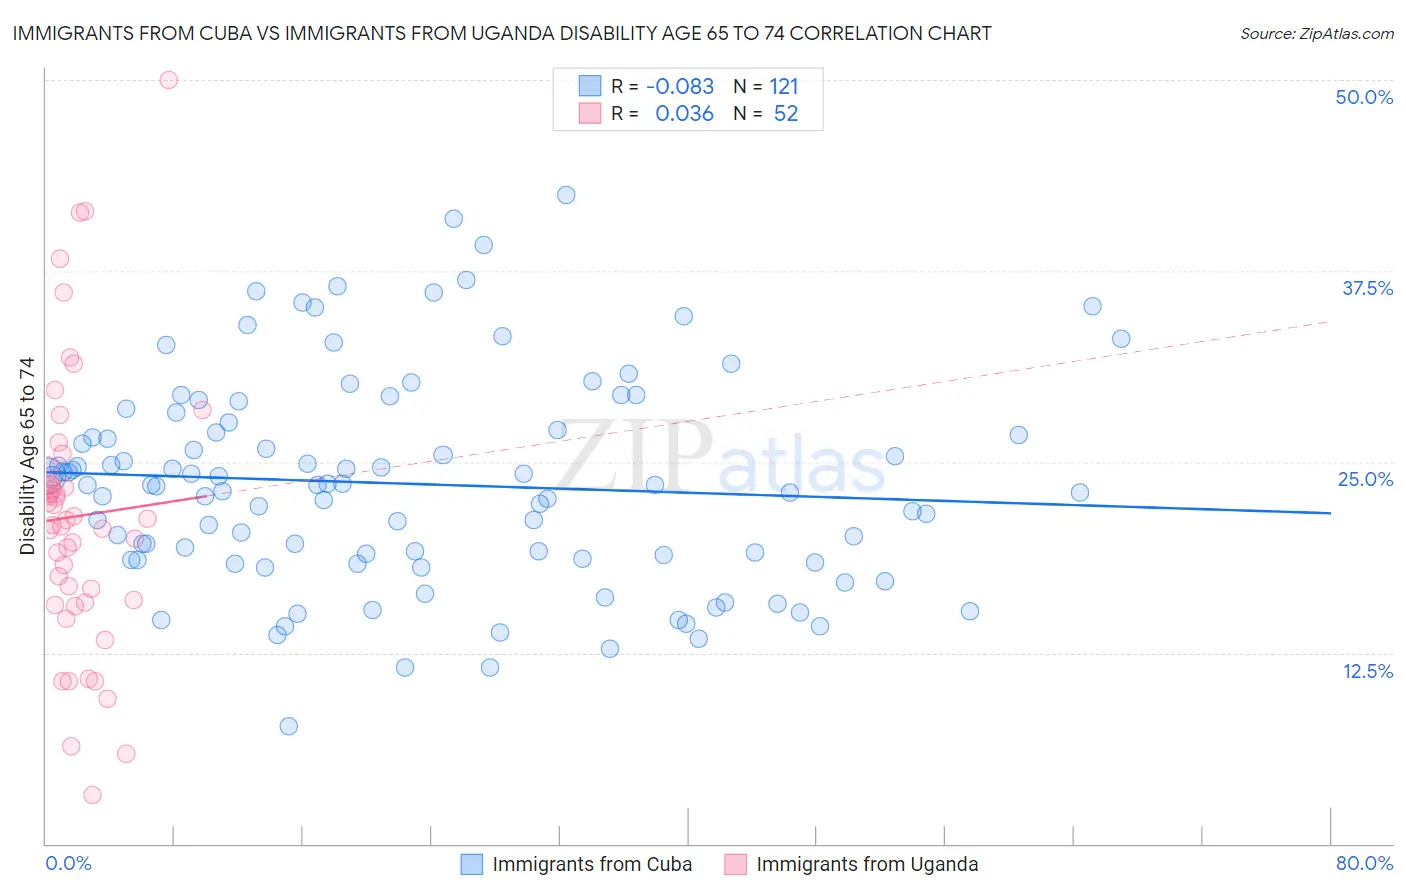
Immigrants from Cuba vs Immigrants from Uganda Disability Age 65 to 74 Correlation Chart
The statistical analysis conducted on geographies consisting of 325,637,866 people shows a slight negative correlation between the proportion of Immigrants from Cuba and percentage of population with a disability between the ages 65 and 75 in the United States with a correlation coefficient (R) of -0.083 and weighted average of 23.6%. Similarly, the statistical analysis conducted on geographies consisting of 125,925,118 people shows no correlation between the proportion of Immigrants from Uganda and percentage of population with a disability between the ages 65 and 75 in the United States with a correlation coefficient (R) of 0.036 and weighted average of 22.8%, a difference of 3.5%.
Disability Age 65 to 74 Correlation Summary
| Measurement | Immigrants from Cuba | Immigrants from Uganda |
| Minimum | 7.7% | 3.2% |
| Maximum | 42.5% | 50.0% |
| Range | 34.8% | 46.8% |
| Mean | 23.6% | 21.4% |
| Median | 23.5% | 21.0% |
| Interquartile 25% (IQ1) | 18.6% | 15.9% |
| Interquartile 75% (IQ3) | 27.4% | 24.1% |
| Interquartile Range (IQR) | 8.8% | 8.2% |
| Standard Deviation (Sample) | 6.8% | 9.2% |
| Standard Deviation (Population) | 6.8% | 9.1% |
Similar Demographics by Disability Age 65 to 74
Demographics Similar to Immigrants from Cuba by Disability Age 65 to 74
In terms of disability age 65 to 74, the demographic groups most similar to Immigrants from Cuba are Scottish (23.6%, a difference of 0.060%), Immigrants from Guyana (23.6%, a difference of 0.18%), Portuguese (23.5%, a difference of 0.24%), Immigrants from Bangladesh (23.6%, a difference of 0.25%), and Basque (23.5%, a difference of 0.27%).
| Demographics | Rating | Rank | Disability Age 65 to 74 |
| Assyrians/Chaldeans/Syriacs | 45.3 /100 | #181 | Average 23.4% |
| Irish | 44.4 /100 | #182 | Average 23.4% |
| Immigrants | Eastern Africa | 42.8 /100 | #183 | Average 23.4% |
| Immigrants | Germany | 42.5 /100 | #184 | Average 23.4% |
| Haitians | 42.4 /100 | #185 | Average 23.4% |
| Basques | 38.4 /100 | #186 | Fair 23.5% |
| Portuguese | 37.8 /100 | #187 | Fair 23.5% |
| Immigrants | Cuba | 34.0 /100 | #188 | Fair 23.6% |
| Scottish | 33.1 /100 | #189 | Fair 23.6% |
| Immigrants | Guyana | 31.2 /100 | #190 | Fair 23.6% |
| Immigrants | Bangladesh | 30.2 /100 | #191 | Fair 23.6% |
| Ecuadorians | 29.7 /100 | #192 | Fair 23.6% |
| English | 28.5 /100 | #193 | Fair 23.6% |
| Sudanese | 27.8 /100 | #194 | Fair 23.7% |
| Immigrants | St. Vincent and the Grenadines | 26.1 /100 | #195 | Fair 23.7% |
Demographics Similar to Immigrants from Uganda by Disability Age 65 to 74
In terms of disability age 65 to 74, the demographic groups most similar to Immigrants from Uganda are Alsatian (22.8%, a difference of 0.030%), Danish (22.8%, a difference of 0.040%), Arab (22.8%, a difference of 0.080%), Immigrants from Uzbekistan (22.8%, a difference of 0.10%), and Belgian (22.7%, a difference of 0.15%).
| Demographics | Rating | Rank | Disability Age 65 to 74 |
| Immigrants | Moldova | 87.3 /100 | #138 | Excellent 22.7% |
| Immigrants | Syria | 85.8 /100 | #139 | Excellent 22.7% |
| Ugandans | 85.4 /100 | #140 | Excellent 22.7% |
| Belgians | 85.3 /100 | #141 | Excellent 22.7% |
| Immigrants | Ethiopia | 85.3 /100 | #142 | Excellent 22.7% |
| Arabs | 84.8 /100 | #143 | Excellent 22.8% |
| Danes | 84.4 /100 | #144 | Excellent 22.8% |
| Immigrants | Uganda | 84.0 /100 | #145 | Excellent 22.8% |
| Alsatians | 83.7 /100 | #146 | Excellent 22.8% |
| Immigrants | Uzbekistan | 83.1 /100 | #147 | Excellent 22.8% |
| New Zealanders | 79.9 /100 | #148 | Good 22.9% |
| Swiss | 79.7 /100 | #149 | Good 22.9% |
| Canadians | 77.7 /100 | #150 | Good 22.9% |
| Immigrants | Morocco | 77.6 /100 | #151 | Good 22.9% |
| Finns | 76.5 /100 | #152 | Good 22.9% |