Zimbabwean vs Immigrants from Uganda Disability Age 65 to 74

COMPARE

Zimbabwean
Race
Ancestry
AfghanAfricanAlaska NativeAlaskan AthabascanAlbanianAleutAlsatianAmericanApacheArabArapahoArgentineanArmenianAssyrian/Chaldean/SyriacAustralianAustrianBahamianBangladeshiBarbadianBasqueBelgianBelizeanBermudanBhutaneseBlackfeetBolivianBrazilianBritishBritish West IndianBulgarianBurmeseCajunCambodianCanadianCape VerdeanCarpatho RusynCelticCentral AmericanCentral American IndianCherokeeCheyenneChickasawChileanChineseChippewaChoctawColombianColvilleComancheCosta RicanCreeCreekCroatianCrowCubanCypriotCzechCzechoslovakianDanishDelawareDominicanDutchDutch West IndianEastern EuropeanEcuadorianEgyptianEnglishEstonianEthiopianEuropeanFijianFilipinoFinnishFrenchFrench American IndianFrench CanadianGermanGerman RussianGhanaianGreekGuamanian/ChamorroGuatemalanGuyaneseHaitianHmongHonduranHopiHoumaHungarianIcelanderIndian (Asian)IndonesianInupiatIranianIraqiIrishIroquoisIsraeliItalianJamaicanJapaneseJordanianKenyanKiowaKoreanLaotianLatvianLebaneseLiberianLithuanianLumbeeLuxembourgerMacedonianMalaysianMalteseMarshalleseMenomineeMexicanMexican American IndianMongolianMoroccanNative HawaiianNavajoNepaleseNew ZealanderNicaraguanNigerianNorthern EuropeanNorwegianOkinawanOsageOttawaPaiutePakistaniPalestinianPanamanianParaguayanPennsylvania GermanPeruvianPimaPolishPortuguesePotawatomiPuebloPuerto RicanPuget Sound SalishRomanianRussianSalvadoranSamoanScandinavianScotch-IrishScottishSeminoleSenegaleseSerbianShoshoneSierra LeoneanSiouxSlavicSlovakSloveneSomaliSouth AfricanSouth AmericanSouth American IndianSoviet UnionSpaniardSpanishSpanish AmericanSpanish American IndianSri LankanSubsaharan AfricanSudaneseSwedishSwissSyrianTaiwaneseThaiTlingit-HaidaTohono O'OdhamTonganTrinidadian and TobagonianTsimshianTurkishU.S. Virgin IslanderUgandanUkrainianUruguayanUteVenezuelanVietnameseWelshWest IndianYakamaYaquiYugoslavianYumanYup'ikZimbabwean
Immigration
NonimmigrantsImmigrantsAfghanistanAfricaAlbaniaArgentinaArmeniaAsiaAustraliaAustriaBahamasBangladeshBarbadosBelarusBelgiumBelizeBoliviaBosnia and HerzegovinaBrazilBulgariaBurma/MyanmarCabo VerdeCambodiaCameroonCanadaCaribbeanCentral AmericaChileChinaColombiaCongoCosta RicaCroatiaCubaCzechoslovakiaDenmarkDominicaDominican RepublicEastern AfricaEastern AsiaEastern EuropeEcuadorEgyptEl SalvadorEnglandEritreaEthiopiaEuropeFijiFranceGermanyGhanaGreeceGrenadaGuatemalaGuyanaHaitiHondurasHong KongHungaryIndiaIndonesiaIranIraqIrelandIsraelItalyJamaicaJapanJordanKazakhstanKenyaKoreaKuwaitLaosLatin AmericaLatviaLebanonLiberiaLithuaniaMalaysiaMexicoMicronesiaMiddle AfricaMoldovaMoroccoNepalNetherlandsNicaraguaNigeriaNorth AmericaNorth MacedoniaNorthern AfricaNorthern EuropeNorwayOceaniaPakistanPanamaPeruPhilippinesPolandPortugalRomaniaRussiaSaudi ArabiaScotlandSenegalSerbiaSierra LeoneSingaporeSomaliaSouth AfricaSouth AmericaSouth Central AsiaSouth Eastern AsiaSouthern EuropeSpainSri LankaSt. Vincent and the GrenadinesSudanSwedenSwitzerlandSyriaTaiwanThailandTrinidad and TobagoTurkeyUkraineUruguayUzbekistanVenezuelaVietnamWest IndiesWestern AfricaWestern AsiaWestern EuropeYemenZaireZimbabweAzores
Immigrants from Uganda
Race
Ancestry
AfghanAfricanAlaska NativeAlaskan AthabascanAlbanianAleutAlsatianAmericanApacheArabArapahoArgentineanArmenianAssyrian/Chaldean/SyriacAustralianAustrianBahamianBangladeshiBarbadianBasqueBelgianBelizeanBermudanBhutaneseBlackfeetBolivianBrazilianBritishBritish West IndianBulgarianBurmeseCajunCambodianCanadianCape VerdeanCarpatho RusynCelticCentral AmericanCentral American IndianCherokeeCheyenneChickasawChileanChineseChippewaChoctawColombianColvilleComancheCosta RicanCreeCreekCroatianCrowCubanCypriotCzechCzechoslovakianDanishDelawareDominicanDutchDutch West IndianEastern EuropeanEcuadorianEgyptianEnglishEstonianEthiopianEuropeanFijianFilipinoFinnishFrenchFrench American IndianFrench CanadianGermanGerman RussianGhanaianGreekGuamanian/ChamorroGuatemalanGuyaneseHaitianHmongHonduranHopiHoumaHungarianIcelanderIndian (Asian)IndonesianInupiatIranianIraqiIrishIroquoisIsraeliItalianJamaicanJapaneseJordanianKenyanKiowaKoreanLaotianLatvianLebaneseLiberianLithuanianLumbeeLuxembourgerMacedonianMalaysianMalteseMarshalleseMenomineeMexicanMexican American IndianMongolianMoroccanNative HawaiianNavajoNepaleseNew ZealanderNicaraguanNigerianNorthern EuropeanNorwegianOkinawanOsageOttawaPaiutePakistaniPalestinianPanamanianParaguayanPennsylvania GermanPeruvianPimaPolishPortuguesePotawatomiPuebloPuerto RicanPuget Sound SalishRomanianRussianSalvadoranSamoanScandinavianScotch-IrishScottishSeminoleSenegaleseSerbianShoshoneSierra LeoneanSiouxSlavicSlovakSloveneSomaliSouth AfricanSouth AmericanSouth American IndianSoviet UnionSpaniardSpanishSpanish AmericanSpanish American IndianSri LankanSubsaharan AfricanSudaneseSwedishSwissSyrianTaiwaneseThaiTlingit-HaidaTohono O'OdhamTonganTrinidadian and TobagonianTsimshianTurkishU.S. Virgin IslanderUgandanUkrainianUruguayanUteVenezuelanVietnameseWelshWest IndianYakamaYaquiYugoslavianYumanYup'ik
Immigration
NonimmigrantsImmigrantsAfghanistanAfricaAlbaniaArgentinaArmeniaAsiaAustraliaAustriaBahamasBangladeshBarbadosBelarusBelgiumBelizeBoliviaBosnia and HerzegovinaBrazilBulgariaBurma/MyanmarCabo VerdeCambodiaCameroonCanadaCaribbeanCentral AmericaChileChinaColombiaCongoCosta RicaCroatiaCubaCzechoslovakiaDenmarkDominicaDominican RepublicEastern AfricaEastern AsiaEastern EuropeEcuadorEgyptEl SalvadorEnglandEritreaEthiopiaEuropeFijiFranceGermanyGhanaGreeceGrenadaGuatemalaGuyanaHaitiHondurasHong KongHungaryIndiaIndonesiaIranIraqIrelandIsraelItalyJamaicaJapanJordanKazakhstanKenyaKoreaKuwaitLaosLatin AmericaLatviaLebanonLiberiaLithuaniaMalaysiaMexicoMicronesiaMiddle AfricaMoldovaMoroccoNepalNetherlandsNicaraguaNigeriaNorth AmericaNorth MacedoniaNorthern AfricaNorthern EuropeNorwayOceaniaPakistanPanamaPeruPhilippinesPolandPortugalRomaniaRussiaSaudi ArabiaScotlandSenegalSerbiaSierra LeoneSingaporeSomaliaSouth AfricaSouth AmericaSouth Central AsiaSouth Eastern AsiaSouthern EuropeSpainSri LankaSt. Vincent and the GrenadinesSudanSwedenSwitzerlandSyriaTaiwanThailandTrinidad and TobagoTurkeyUgandaUkraineUruguayUzbekistanVenezuelaVietnamWest IndiesWestern AfricaWestern AsiaWestern EuropeYemenZaireZimbabweAzores
Disability Age 65 to 74
Income
Poverty
Unemployment
Labor Participation
Family Structure
Vehicle Availability
Education Level
Disability

Disability Age 65 to 74 Comparison

Zimbabweans

Immigrants from Uganda

Exceptional
Excellent
21.5%
DISABILITY AGE 65 TO 74
99.5/ 100
METRIC RATING
59th/ 347
METRIC RANK
22.8%
DISABILITY AGE 65 TO 74
84.0/ 100
METRIC RATING
145th/ 347
METRIC RANK

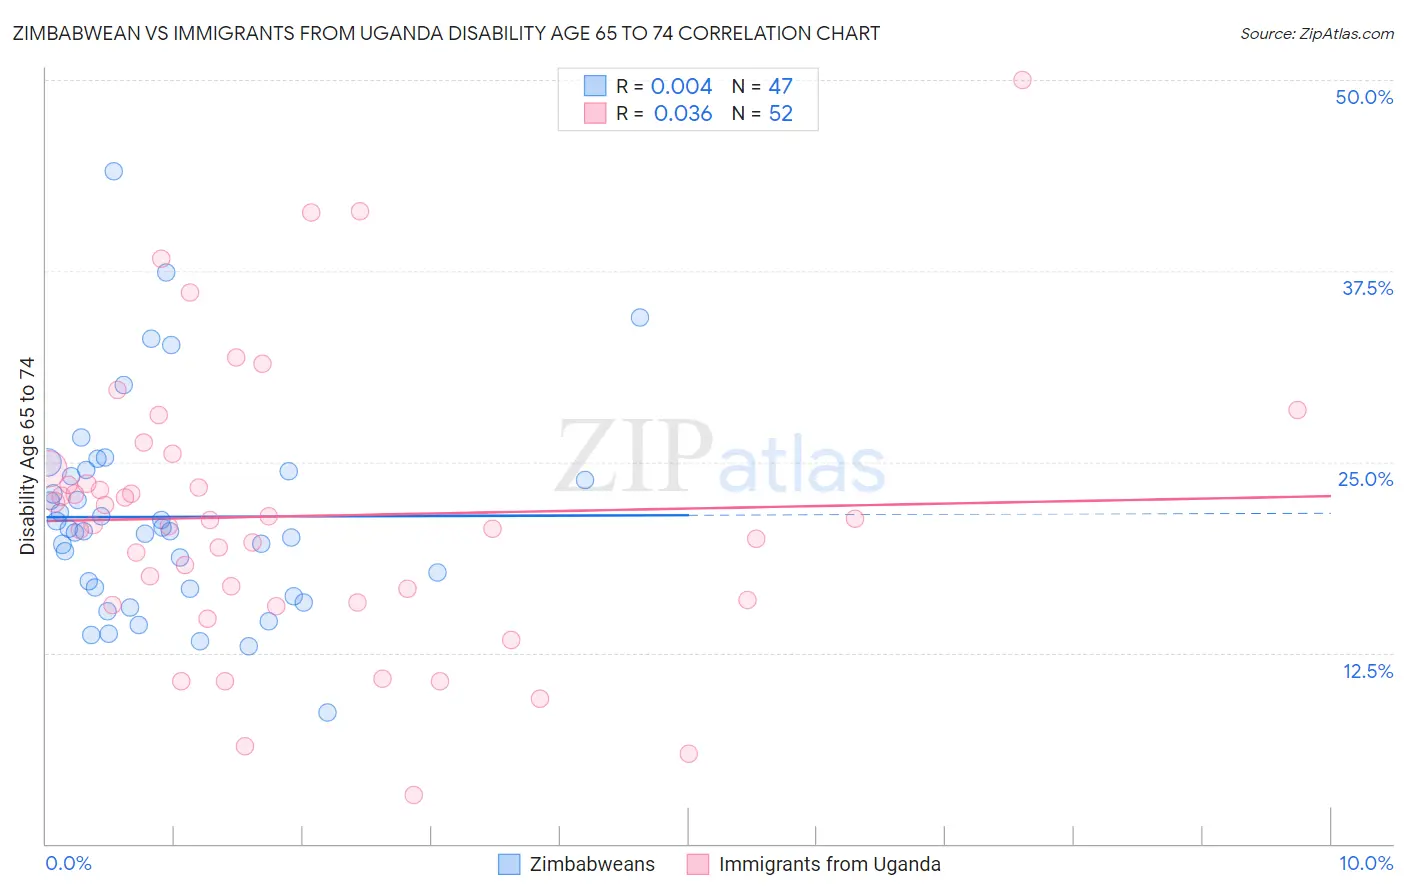
Zimbabwean vs Immigrants from Uganda Disability Age 65 to 74 Correlation Chart

The statistical analysis conducted on geographies consisting of 69,127,978 people shows no correlation between the proportion of Zimbabweans and percentage of population with a disability between the ages 65 and 75 in the United States with a correlation coefficient (R) of 0.004 and weighted average of 21.5%. Similarly, the statistical analysis conducted on geographies consisting of 125,925,118 people shows no correlation between the proportion of Immigrants from Uganda and percentage of population with a disability between the ages 65 and 75 in the United States with a correlation coefficient (R) of 0.036 and weighted average of 22.8%, a difference of 5.7%.
Zimbabwean vs Immigrants from Uganda Disability Age 65 to 74

Disability Age 65 to 74 Correlation Summary

MeasurementZimbabweanImmigrants from Uganda
Minimum8.6%3.2%
Maximum44.0%50.0%
Range35.4%46.8%
Mean21.4%21.4%
Median20.5%21.0%
Interquartile 25% (IQ1)16.7%15.9%
Interquartile 75% (IQ3)24.4%24.1%
Interquartile Range (IQR)7.7%8.2%
Standard Deviation (Sample)6.8%9.2%
Standard Deviation (Population)6.7%9.1%

Similar Demographics by Disability Age 65 to 74

Demographics Similar to Zimbabweans by Disability Age 65 to 74

In terms of disability age 65 to 74, the demographic groups most similar to Zimbabweans are Immigrants from Pakistan (21.5%, a difference of 0.030%), Immigrants from North Macedonia (21.6%, a difference of 0.030%), Egyptian (21.6%, a difference of 0.050%), Immigrants from Asia (21.5%, a difference of 0.070%), and Carpatho Rusyn (21.6%, a difference of 0.080%).
DemographicsRating | RankDisability Age 65 to 74
Immigrants | France
99.6
/100
|
#52
Exceptional
21.5%
Bhutanese
99.6
/100
|
#53
Exceptional
21.5%
Immigrants | Italy
99.6
/100
|
#54
Exceptional
21.5%
Immigrants | Romania
99.5
/100
|
#55
Exceptional
21.5%
Immigrants | Denmark
99.5
/100
|
#56
Exceptional
21.5%
Immigrants | Asia
99.5
/100
|
#57
Exceptional
21.5%
Immigrants | Pakistan
99.5
/100
|
#58
Exceptional
21.5%
Zimbabweans
99.5
/100
|
#59
Exceptional
21.5%
Immigrants | North Macedonia
99.5
/100
|
#60
Exceptional
21.6%
Egyptians
99.5
/100
|
#61
Exceptional
21.6%
Carpatho Rusyns
99.5
/100
|
#62
Exceptional
21.6%
Immigrants | Europe
99.4
/100
|
#63
Exceptional
21.6%
Immigrants | Latvia
99.4
/100
|
#64
Exceptional
21.6%
Immigrants | Russia
99.4
/100
|
#65
Exceptional
21.6%
Maltese
99.4
/100
|
#66
Exceptional
21.6%

Demographics Similar to Immigrants from Uganda by Disability Age 65 to 74

In terms of disability age 65 to 74, the demographic groups most similar to Immigrants from Uganda are Alsatian (22.8%, a difference of 0.030%), Danish (22.8%, a difference of 0.040%), Arab (22.8%, a difference of 0.080%), Immigrants from Uzbekistan (22.8%, a difference of 0.10%), and Belgian (22.7%, a difference of 0.15%).
DemographicsRating | RankDisability Age 65 to 74
Immigrants | Moldova
87.3
/100
|
#138
Excellent
22.7%
Immigrants | Syria
85.8
/100
|
#139
Excellent
22.7%
Ugandans
85.4
/100
|
#140
Excellent
22.7%
Belgians
85.3
/100
|
#141
Excellent
22.7%
Immigrants | Ethiopia
85.3
/100
|
#142
Excellent
22.7%
Arabs
84.8
/100
|
#143
Excellent
22.8%
Danes
84.4
/100
|
#144
Excellent
22.8%
Immigrants | Uganda
84.0
/100
|
#145
Excellent
22.8%
Alsatians
83.7
/100
|
#146
Excellent
22.8%
Immigrants | Uzbekistan
83.1
/100
|
#147
Excellent
22.8%
New Zealanders
79.9
/100
|
#148
Good
22.9%
Swiss
79.7
/100
|
#149
Good
22.9%
Canadians
77.7
/100
|
#150
Good
22.9%
Immigrants | Morocco
77.6
/100
|
#151
Good
22.9%
Finns
76.5
/100
|
#152
Good
22.9%