Inupiat vs Ghanaian Disability Age 65 to 74
COMPARE
Inupiat
Ghanaian
Disability Age 65 to 74
Disability Age 65 to 74 Comparison
Inupiat
Ghanaians
34.5%
DISABILITY AGE 65 TO 74
0.0/ 100
METRIC RATING
344th/ 347
METRIC RANK
24.1%
DISABILITY AGE 65 TO 74
10.4/ 100
METRIC RATING
220th/ 347
METRIC RANK
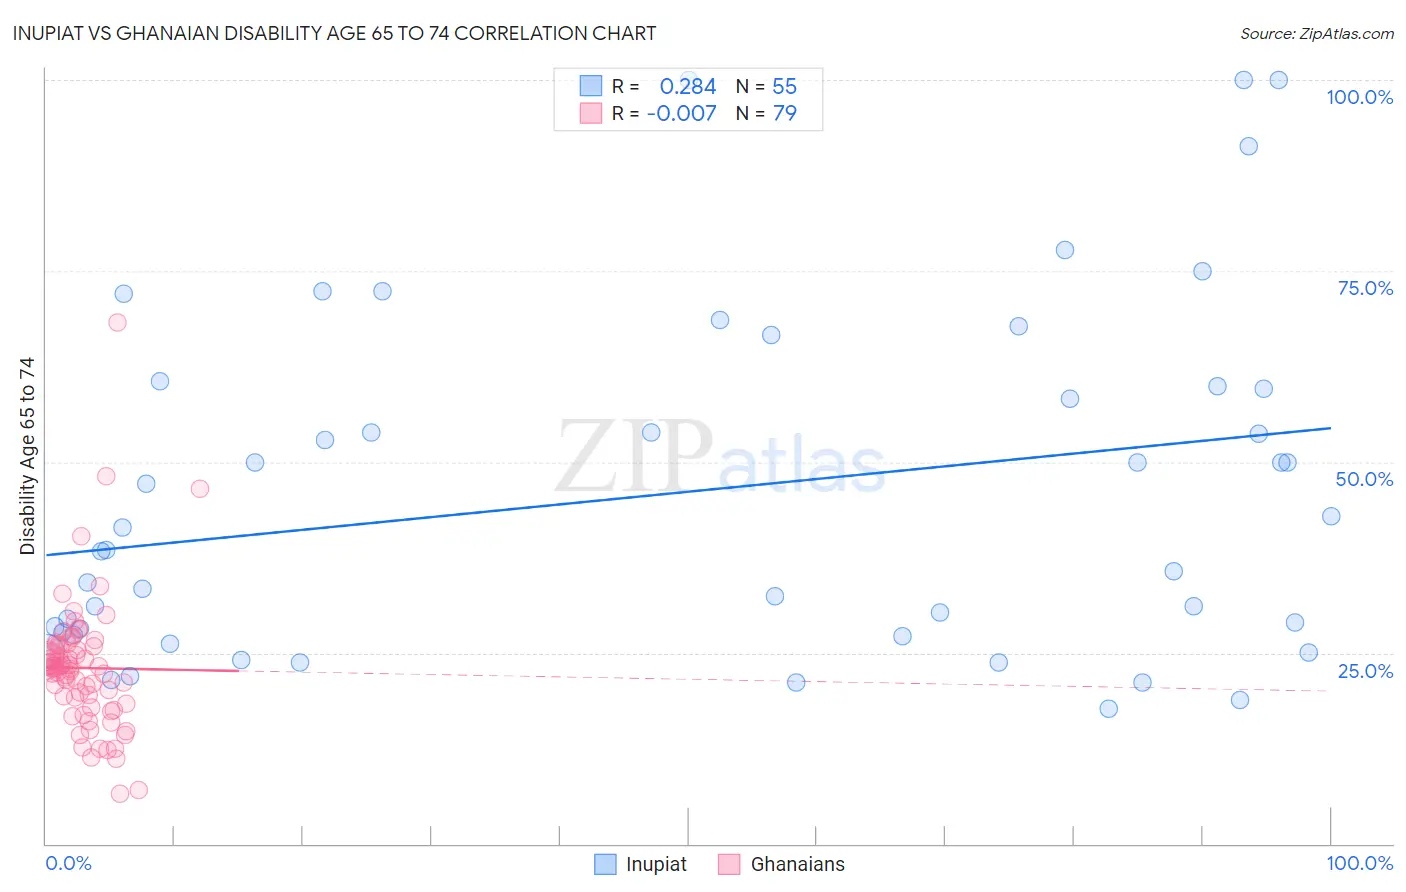
Inupiat vs Ghanaian Disability Age 65 to 74 Correlation Chart
The statistical analysis conducted on geographies consisting of 96,264,224 people shows a weak positive correlation between the proportion of Inupiat and percentage of population with a disability between the ages 65 and 75 in the United States with a correlation coefficient (R) of 0.284 and weighted average of 34.5%. Similarly, the statistical analysis conducted on geographies consisting of 190,307,829 people shows no correlation between the proportion of Ghanaians and percentage of population with a disability between the ages 65 and 75 in the United States with a correlation coefficient (R) of -0.007 and weighted average of 24.1%, a difference of 43.5%.
Disability Age 65 to 74 Correlation Summary
| Measurement | Inupiat | Ghanaian |
| Minimum | 17.6% | 6.5% |
| Maximum | 100.0% | 68.3% |
| Range | 82.4% | 61.8% |
| Mean | 45.8% | 23.0% |
| Median | 38.4% | 22.9% |
| Interquartile 25% (IQ1) | 27.4% | 18.3% |
| Interquartile 75% (IQ3) | 60.0% | 25.9% |
| Interquartile Range (IQR) | 32.6% | 7.5% |
| Standard Deviation (Sample) | 22.6% | 8.8% |
| Standard Deviation (Population) | 22.4% | 8.7% |
Similar Demographics by Disability Age 65 to 74
Demographics Similar to Inupiat by Disability Age 65 to 74
In terms of disability age 65 to 74, the demographic groups most similar to Inupiat are Navajo (33.3%, a difference of 3.6%), Pueblo (33.1%, a difference of 4.3%), Tohono O'odham (36.0%, a difference of 4.3%), Tsimshian (32.9%, a difference of 5.0%), and Lumbee (32.7%, a difference of 5.5%).
| Demographics | Rating | Rank | Disability Age 65 to 74 |
| Colville | 0.0 /100 | #333 | Tragic 30.5% |
| Alaska Natives | 0.0 /100 | #334 | Tragic 30.6% |
| Cheyenne | 0.0 /100 | #335 | Tragic 31.1% |
| Yuman | 0.0 /100 | #336 | Tragic 31.5% |
| Houma | 0.0 /100 | #337 | Tragic 32.3% |
| Alaskan Athabascans | 0.0 /100 | #338 | Tragic 32.4% |
| Kiowa | 0.0 /100 | #339 | Tragic 32.6% |
| Lumbee | 0.0 /100 | #340 | Tragic 32.7% |
| Tsimshian | 0.0 /100 | #341 | Tragic 32.9% |
| Pueblo | 0.0 /100 | #342 | Tragic 33.1% |
| Navajo | 0.0 /100 | #343 | Tragic 33.3% |
| Inupiat | 0.0 /100 | #344 | Tragic 34.5% |
| Tohono O'odham | 0.0 /100 | #345 | Tragic 36.0% |
| Yup'ik | 0.0 /100 | #346 | Tragic 37.8% |
| Pima | 0.0 /100 | #347 | Tragic 38.6% |
Demographics Similar to Ghanaians by Disability Age 65 to 74
In terms of disability age 65 to 74, the demographic groups most similar to Ghanaians are Immigrants from Nicaragua (24.1%, a difference of 0.090%), Native Hawaiian (24.1%, a difference of 0.16%), Immigrants from Burma/Myanmar (24.0%, a difference of 0.18%), Immigrants from Portugal (24.0%, a difference of 0.19%), and Immigrants from Nigeria (24.0%, a difference of 0.19%).
| Demographics | Rating | Rank | Disability Age 65 to 74 |
| Nicaraguans | 14.3 /100 | #213 | Poor 23.9% |
| Immigrants | Oceania | 13.6 /100 | #214 | Poor 24.0% |
| Pennsylvania Germans | 13.3 /100 | #215 | Poor 24.0% |
| Jamaicans | 12.2 /100 | #216 | Poor 24.0% |
| Immigrants | Portugal | 11.7 /100 | #217 | Poor 24.0% |
| Immigrants | Nigeria | 11.7 /100 | #218 | Poor 24.0% |
| Immigrants | Burma/Myanmar | 11.6 /100 | #219 | Poor 24.0% |
| Ghanaians | 10.4 /100 | #220 | Poor 24.1% |
| Immigrants | Nicaragua | 9.8 /100 | #221 | Tragic 24.1% |
| Native Hawaiians | 9.3 /100 | #222 | Tragic 24.1% |
| Immigrants | Middle Africa | 8.9 /100 | #223 | Tragic 24.1% |
| Immigrants | Panama | 8.6 /100 | #224 | Tragic 24.1% |
| Bermudans | 8.2 /100 | #225 | Tragic 24.2% |
| Iraqis | 8.1 /100 | #226 | Tragic 24.2% |
| Nigerians | 7.8 /100 | #227 | Tragic 24.2% |