Mongolian vs Immigrants from Nigeria Male Disability
COMPARE
Mongolian
Immigrants from Nigeria
Male Disability
Male Disability Comparison
Mongolians
Immigrants from Nigeria
10.3%
MALE DISABILITY
99.7/ 100
METRIC RATING
42nd/ 347
METRIC RANK
10.8%
MALE DISABILITY
95.1/ 100
METRIC RATING
104th/ 347
METRIC RANK
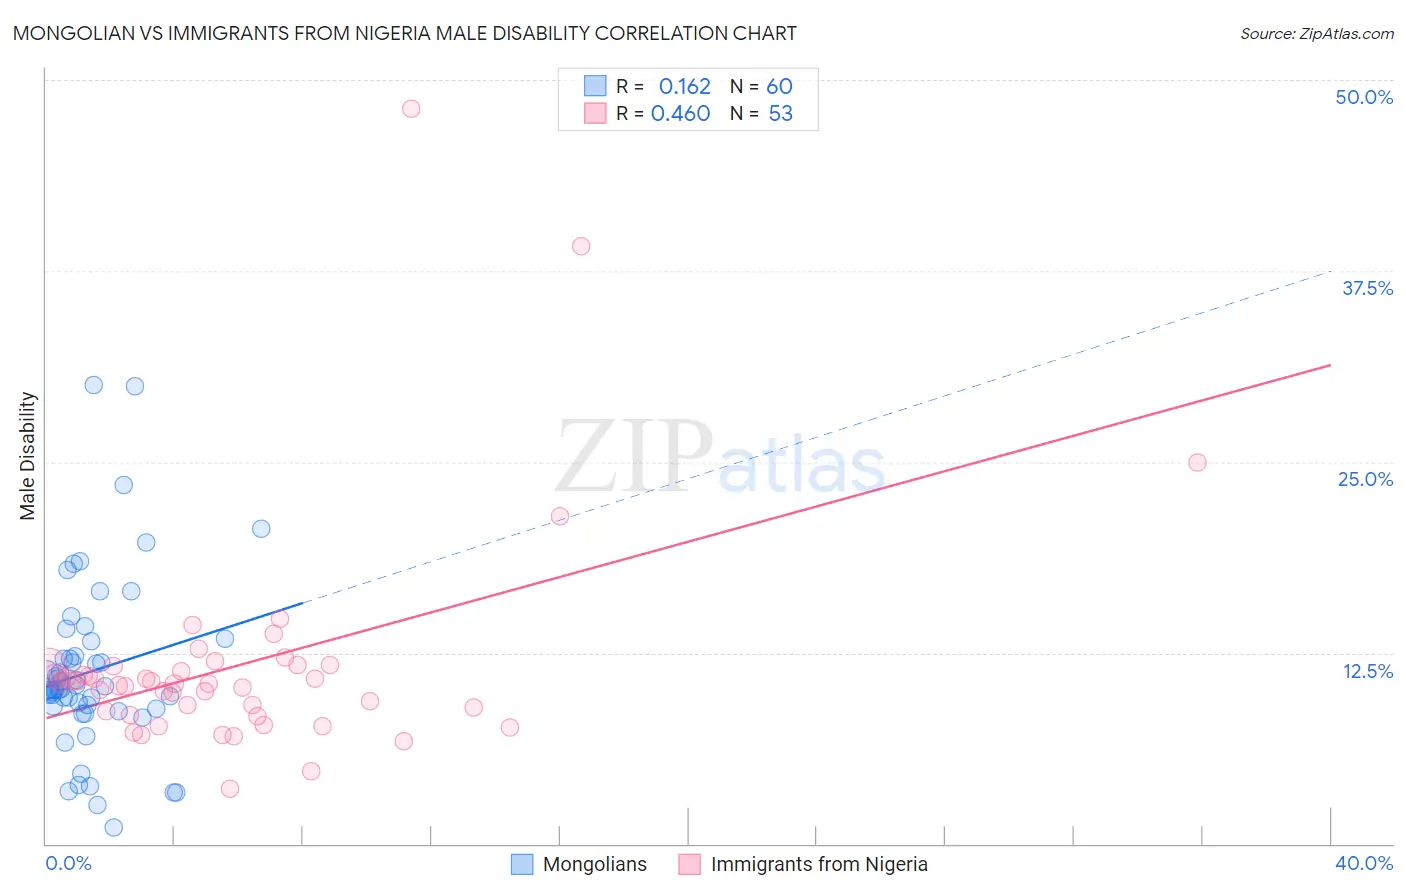
Mongolian vs Immigrants from Nigeria Male Disability Correlation Chart
The statistical analysis conducted on geographies consisting of 140,361,312 people shows a poor positive correlation between the proportion of Mongolians and percentage of males with a disability in the United States with a correlation coefficient (R) of 0.162 and weighted average of 10.3%. Similarly, the statistical analysis conducted on geographies consisting of 283,467,451 people shows a moderate positive correlation between the proportion of Immigrants from Nigeria and percentage of males with a disability in the United States with a correlation coefficient (R) of 0.460 and weighted average of 10.8%, a difference of 4.5%.
Male Disability Correlation Summary
| Measurement | Mongolian | Immigrants from Nigeria |
| Minimum | 1.1% | 3.6% |
| Maximum | 30.0% | 48.1% |
| Range | 28.9% | 44.5% |
| Mean | 11.3% | 11.7% |
| Median | 10.1% | 10.5% |
| Interquartile 25% (IQ1) | 8.9% | 8.5% |
| Interquartile 75% (IQ3) | 12.8% | 11.6% |
| Interquartile Range (IQR) | 3.9% | 3.1% |
| Standard Deviation (Sample) | 5.7% | 7.3% |
| Standard Deviation (Population) | 5.6% | 7.2% |
Similar Demographics by Male Disability
Demographics Similar to Mongolians by Male Disability
In terms of male disability, the demographic groups most similar to Mongolians are Immigrants from Bangladesh (10.3%, a difference of 0.020%), Immigrants from El Salvador (10.3%, a difference of 0.090%), Turkish (10.3%, a difference of 0.10%), Cambodian (10.3%, a difference of 0.18%), and Immigrants from Peru (10.3%, a difference of 0.22%).
| Demographics | Rating | Rank | Male Disability |
| Immigrants | Argentina | 99.9 /100 | #35 | Exceptional 10.2% |
| Ethiopians | 99.8 /100 | #36 | Exceptional 10.2% |
| Immigrants | Indonesia | 99.8 /100 | #37 | Exceptional 10.2% |
| Immigrants | Kuwait | 99.8 /100 | #38 | Exceptional 10.2% |
| Afghans | 99.8 /100 | #39 | Exceptional 10.2% |
| Immigrants | Nepal | 99.8 /100 | #40 | Exceptional 10.3% |
| Taiwanese | 99.8 /100 | #41 | Exceptional 10.3% |
| Mongolians | 99.7 /100 | #42 | Exceptional 10.3% |
| Immigrants | Bangladesh | 99.7 /100 | #43 | Exceptional 10.3% |
| Immigrants | El Salvador | 99.7 /100 | #44 | Exceptional 10.3% |
| Turks | 99.7 /100 | #45 | Exceptional 10.3% |
| Cambodians | 99.7 /100 | #46 | Exceptional 10.3% |
| Immigrants | Peru | 99.7 /100 | #47 | Exceptional 10.3% |
| Israelis | 99.7 /100 | #48 | Exceptional 10.3% |
| Immigrants | Spain | 99.7 /100 | #49 | Exceptional 10.3% |
Demographics Similar to Immigrants from Nigeria by Male Disability
In terms of male disability, the demographic groups most similar to Immigrants from Nigeria are Immigrants from Brazil (10.8%, a difference of 0.010%), Uruguayan (10.7%, a difference of 0.060%), Immigrants from Syria (10.8%, a difference of 0.060%), Immigrants from Eastern Europe (10.7%, a difference of 0.080%), and Immigrants from Greece (10.7%, a difference of 0.17%).
| Demographics | Rating | Rank | Male Disability |
| Immigrants | Armenia | 96.6 /100 | #97 | Exceptional 10.7% |
| Immigrants | Romania | 96.5 /100 | #98 | Exceptional 10.7% |
| Immigrants | Switzerland | 96.1 /100 | #99 | Exceptional 10.7% |
| Immigrants | Kazakhstan | 95.9 /100 | #100 | Exceptional 10.7% |
| Immigrants | Greece | 95.6 /100 | #101 | Exceptional 10.7% |
| Immigrants | Eastern Europe | 95.3 /100 | #102 | Exceptional 10.7% |
| Uruguayans | 95.3 /100 | #103 | Exceptional 10.7% |
| Immigrants | Nigeria | 95.1 /100 | #104 | Exceptional 10.8% |
| Immigrants | Brazil | 95.0 /100 | #105 | Exceptional 10.8% |
| Immigrants | Syria | 94.9 /100 | #106 | Exceptional 10.8% |
| Immigrants | Eastern Africa | 94.3 /100 | #107 | Exceptional 10.8% |
| Immigrants | Belgium | 94.2 /100 | #108 | Exceptional 10.8% |
| Immigrants | Uganda | 94.0 /100 | #109 | Exceptional 10.8% |
| Immigrants | Immigrants | 93.9 /100 | #110 | Exceptional 10.8% |
| Immigrants | Uruguay | 93.8 /100 | #111 | Exceptional 10.8% |