Indonesian vs Soviet Union Bachelor's Degree
COMPARE
Indonesian
Soviet Union
Bachelor's Degree
Bachelor's Degree Comparison
Indonesians
Soviet Union
33.5%
BACHELOR'S DEGREE
0.9/ 100
METRIC RATING
250th/ 347
METRIC RANK
47.9%
BACHELOR'S DEGREE
100.0/ 100
METRIC RATING
16th/ 347
METRIC RANK
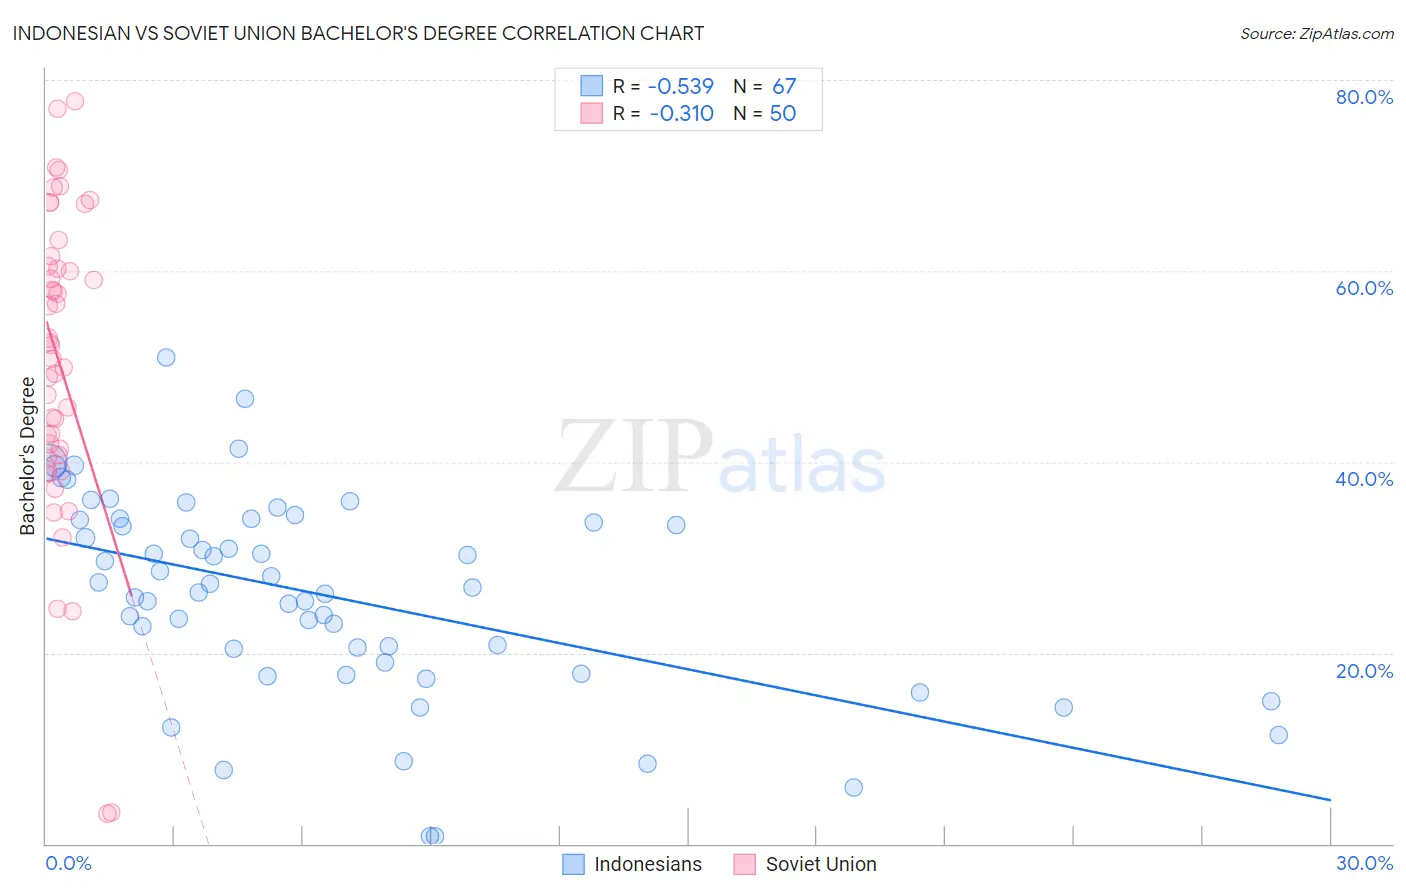
Indonesian vs Soviet Union Bachelor's Degree Correlation Chart
The statistical analysis conducted on geographies consisting of 162,716,505 people shows a substantial negative correlation between the proportion of Indonesians and percentage of population with at least bachelor's degree education in the United States with a correlation coefficient (R) of -0.539 and weighted average of 33.5%. Similarly, the statistical analysis conducted on geographies consisting of 43,514,626 people shows a mild negative correlation between the proportion of Soviet Union and percentage of population with at least bachelor's degree education in the United States with a correlation coefficient (R) of -0.310 and weighted average of 47.9%, a difference of 42.9%.
Bachelor's Degree Correlation Summary
| Measurement | Indonesian | Soviet Union |
| Minimum | 0.73% | 3.1% |
| Maximum | 50.9% | 77.7% |
| Range | 50.2% | 74.6% |
| Mean | 26.1% | 50.2% |
| Median | 26.9% | 51.5% |
| Interquartile 25% (IQ1) | 19.0% | 40.7% |
| Interquartile 75% (IQ3) | 33.9% | 60.5% |
| Interquartile Range (IQR) | 14.9% | 19.8% |
| Standard Deviation (Sample) | 10.5% | 16.2% |
| Standard Deviation (Population) | 10.4% | 16.0% |
Similar Demographics by Bachelor's Degree
Demographics Similar to Indonesians by Bachelor's Degree
In terms of bachelor's degree, the demographic groups most similar to Indonesians are Immigrants from Liberia (33.5%, a difference of 0.010%), Cree (33.6%, a difference of 0.13%), Immigrants from Congo (33.6%, a difference of 0.15%), Jamaican (33.6%, a difference of 0.24%), and Immigrants from Fiji (33.7%, a difference of 0.60%).
| Demographics | Rating | Rank | Bachelor's Degree |
| Immigrants | Guyana | 1.4 /100 | #243 | Tragic 33.9% |
| Delaware | 1.2 /100 | #244 | Tragic 33.8% |
| Immigrants | Fiji | 1.2 /100 | #245 | Tragic 33.7% |
| Jamaicans | 1.0 /100 | #246 | Tragic 33.6% |
| Immigrants | Congo | 1.0 /100 | #247 | Tragic 33.6% |
| Cree | 1.0 /100 | #248 | Tragic 33.6% |
| Immigrants | Liberia | 0.9 /100 | #249 | Tragic 33.5% |
| Indonesians | 0.9 /100 | #250 | Tragic 33.5% |
| Japanese | 0.7 /100 | #251 | Tragic 33.3% |
| Immigrants | Bahamas | 0.7 /100 | #252 | Tragic 33.3% |
| U.S. Virgin Islanders | 0.7 /100 | #253 | Tragic 33.2% |
| Native Hawaiians | 0.7 /100 | #254 | Tragic 33.2% |
| Iroquois | 0.7 /100 | #255 | Tragic 33.2% |
| Nicaraguans | 0.6 /100 | #256 | Tragic 33.1% |
| Spanish Americans | 0.6 /100 | #257 | Tragic 33.1% |
Demographics Similar to Soviet Union by Bachelor's Degree
In terms of bachelor's degree, the demographic groups most similar to Soviet Union are Immigrants from Eastern Asia (48.1%, a difference of 0.46%), Immigrants from Hong Kong (48.2%, a difference of 0.60%), Eastern European (47.5%, a difference of 0.86%), Immigrants from South Central Asia (48.3%, a difference of 0.88%), and Indian (Asian) (47.4%, a difference of 1.0%).
| Demographics | Rating | Rank | Bachelor's Degree |
| Immigrants | Israel | 100.0 /100 | #9 | Exceptional 50.0% |
| Cypriots | 100.0 /100 | #10 | Exceptional 49.0% |
| Immigrants | Australia | 100.0 /100 | #11 | Exceptional 48.5% |
| Immigrants | China | 100.0 /100 | #12 | Exceptional 48.4% |
| Immigrants | South Central Asia | 100.0 /100 | #13 | Exceptional 48.3% |
| Immigrants | Hong Kong | 100.0 /100 | #14 | Exceptional 48.2% |
| Immigrants | Eastern Asia | 100.0 /100 | #15 | Exceptional 48.1% |
| Soviet Union | 100.0 /100 | #16 | Exceptional 47.9% |
| Eastern Europeans | 100.0 /100 | #17 | Exceptional 47.5% |
| Indians (Asian) | 100.0 /100 | #18 | Exceptional 47.4% |
| Cambodians | 100.0 /100 | #19 | Exceptional 47.2% |
| Immigrants | Switzerland | 100.0 /100 | #20 | Exceptional 47.1% |
| Immigrants | Ireland | 100.0 /100 | #21 | Exceptional 47.1% |
| Immigrants | Belgium | 100.0 /100 | #22 | Exceptional 47.0% |
| Immigrants | Sweden | 100.0 /100 | #23 | Exceptional 47.0% |