Indonesian vs Irish Male Disability
COMPARE
Indonesian
Irish
Male Disability
Male Disability Comparison
Indonesians
Irish
11.6%
MALE DISABILITY
5.9/ 100
METRIC RATING
215th/ 347
METRIC RANK
12.7%
MALE DISABILITY
0.0/ 100
METRIC RATING
282nd/ 347
METRIC RANK
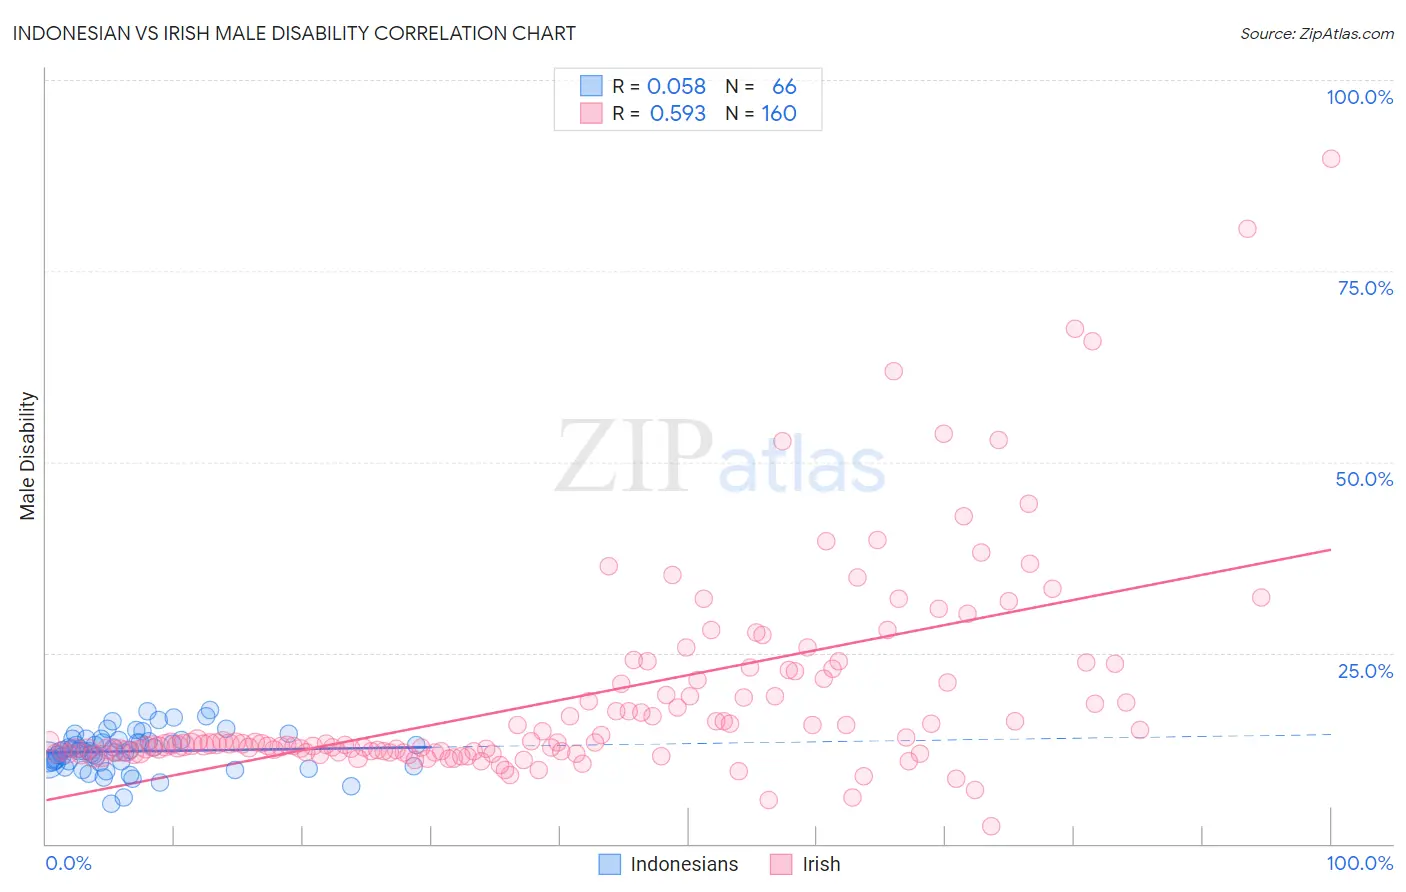
Indonesian vs Irish Male Disability Correlation Chart
The statistical analysis conducted on geographies consisting of 162,722,294 people shows a slight positive correlation between the proportion of Indonesians and percentage of males with a disability in the United States with a correlation coefficient (R) of 0.058 and weighted average of 11.6%. Similarly, the statistical analysis conducted on geographies consisting of 580,201,634 people shows a substantial positive correlation between the proportion of Irish and percentage of males with a disability in the United States with a correlation coefficient (R) of 0.593 and weighted average of 12.7%, a difference of 9.2%.
Male Disability Correlation Summary
| Measurement | Indonesian | Irish |
| Minimum | 5.2% | 2.4% |
| Maximum | 17.5% | 89.8% |
| Range | 12.2% | 87.4% |
| Mean | 12.1% | 19.1% |
| Median | 12.2% | 13.1% |
| Interquartile 25% (IQ1) | 10.8% | 12.0% |
| Interquartile 75% (IQ3) | 13.5% | 21.6% |
| Interquartile Range (IQR) | 2.7% | 9.5% |
| Standard Deviation (Sample) | 2.5% | 13.6% |
| Standard Deviation (Population) | 2.5% | 13.5% |
Similar Demographics by Male Disability
Demographics Similar to Indonesians by Male Disability
In terms of male disability, the demographic groups most similar to Indonesians are Lithuanian (11.6%, a difference of 0.16%), Immigrants from Dominican Republic (11.7%, a difference of 0.28%), Immigrants from Dominica (11.7%, a difference of 0.34%), Mexican American Indian (11.6%, a difference of 0.40%), and Immigrants from Scotland (11.6%, a difference of 0.48%).
| Demographics | Rating | Rank | Male Disability |
| Icelanders | 10.1 /100 | #208 | Poor 11.6% |
| Spanish American Indians | 10.1 /100 | #209 | Poor 11.6% |
| Ute | 9.4 /100 | #210 | Tragic 11.6% |
| Immigrants | Thailand | 8.4 /100 | #211 | Tragic 11.6% |
| Immigrants | Scotland | 8.2 /100 | #212 | Tragic 11.6% |
| Mexican American Indians | 7.8 /100 | #213 | Tragic 11.6% |
| Lithuanians | 6.6 /100 | #214 | Tragic 11.6% |
| Indonesians | 5.9 /100 | #215 | Tragic 11.6% |
| Immigrants | Dominican Republic | 4.9 /100 | #216 | Tragic 11.7% |
| Immigrants | Dominica | 4.6 /100 | #217 | Tragic 11.7% |
| Immigrants | England | 4.0 /100 | #218 | Tragic 11.7% |
| Panamanians | 3.8 /100 | #219 | Tragic 11.7% |
| Immigrants | Western Europe | 3.8 /100 | #220 | Tragic 11.7% |
| Immigrants | Congo | 3.7 /100 | #221 | Tragic 11.7% |
| Alsatians | 3.3 /100 | #222 | Tragic 11.7% |
Demographics Similar to Irish by Male Disability
In terms of male disability, the demographic groups most similar to Irish are German (12.7%, a difference of 0.010%), Sioux (12.7%, a difference of 0.060%), Dutch (12.7%, a difference of 0.11%), Slovak (12.7%, a difference of 0.16%), and Spanish (12.7%, a difference of 0.28%).
| Demographics | Rating | Rank | Male Disability |
| Fijians | 0.0 /100 | #275 | Tragic 12.6% |
| Africans | 0.0 /100 | #276 | Tragic 12.6% |
| Finns | 0.0 /100 | #277 | Tragic 12.6% |
| Central American Indians | 0.0 /100 | #278 | Tragic 12.7% |
| Slovaks | 0.0 /100 | #279 | Tragic 12.7% |
| Dutch | 0.0 /100 | #280 | Tragic 12.7% |
| Sioux | 0.0 /100 | #281 | Tragic 12.7% |
| Irish | 0.0 /100 | #282 | Tragic 12.7% |
| Germans | 0.0 /100 | #283 | Tragic 12.7% |
| Spanish | 0.0 /100 | #284 | Tragic 12.7% |
| Welsh | 0.0 /100 | #285 | Tragic 12.7% |
| Scottish | 0.0 /100 | #286 | Tragic 12.8% |
| Cape Verdeans | 0.0 /100 | #287 | Tragic 12.8% |
| Yup'ik | 0.0 /100 | #288 | Tragic 12.8% |
| Immigrants | Cabo Verde | 0.0 /100 | #289 | Tragic 12.8% |