Indonesian vs Immigrants from Sudan Male Disability
COMPARE
Indonesian
Immigrants from Sudan
Male Disability
Male Disability Comparison
Indonesians
Immigrants from Sudan
11.6%
MALE DISABILITY
5.9/ 100
METRIC RATING
215th/ 347
METRIC RANK
11.0%
MALE DISABILITY
81.5/ 100
METRIC RATING
142nd/ 347
METRIC RANK
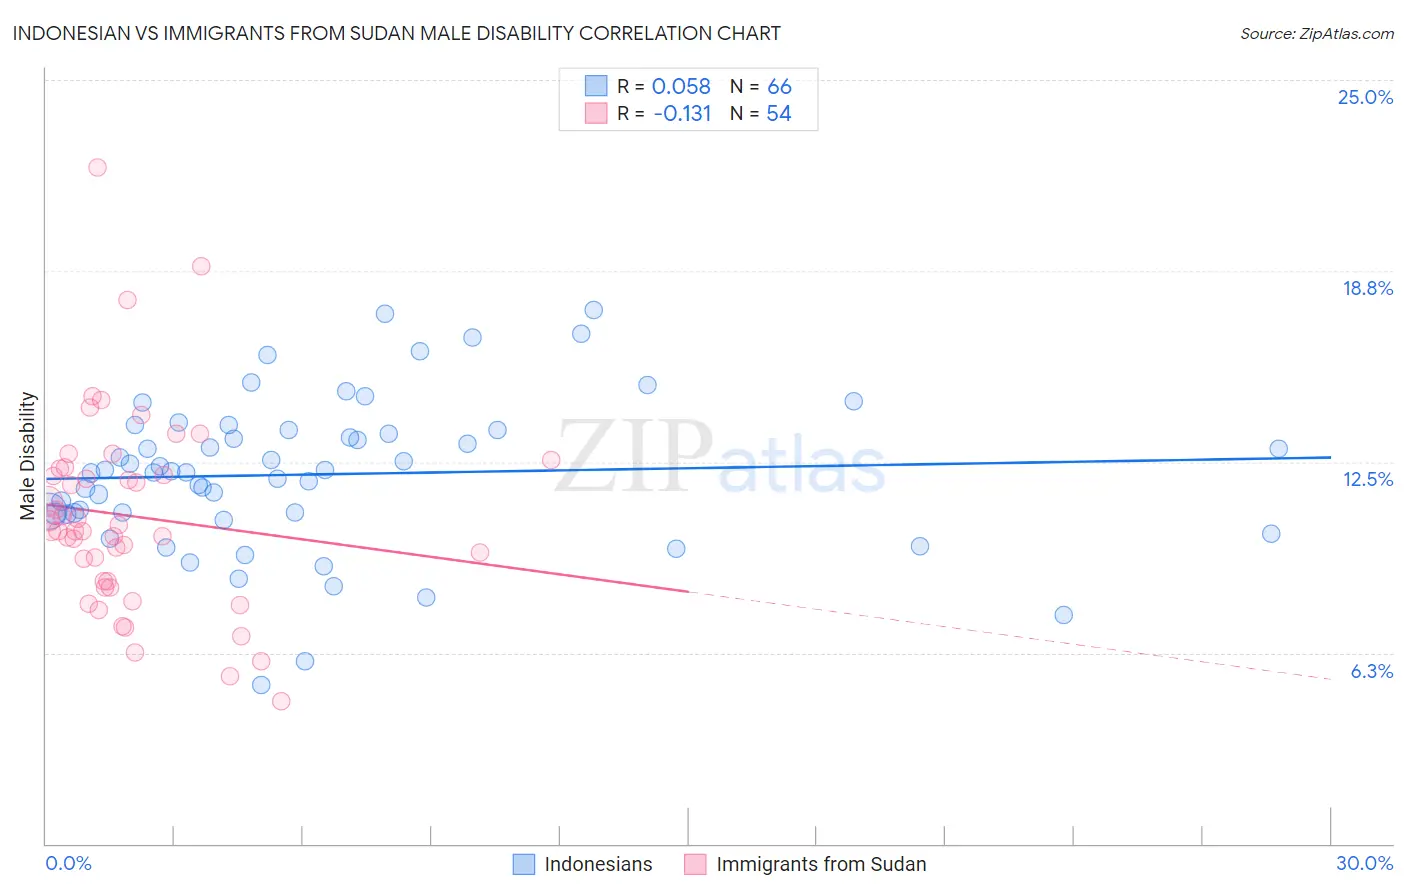
Indonesian vs Immigrants from Sudan Male Disability Correlation Chart
The statistical analysis conducted on geographies consisting of 162,722,294 people shows a slight positive correlation between the proportion of Indonesians and percentage of males with a disability in the United States with a correlation coefficient (R) of 0.058 and weighted average of 11.6%. Similarly, the statistical analysis conducted on geographies consisting of 118,961,882 people shows a poor negative correlation between the proportion of Immigrants from Sudan and percentage of males with a disability in the United States with a correlation coefficient (R) of -0.131 and weighted average of 11.0%, a difference of 6.0%.
Male Disability Correlation Summary
| Measurement | Indonesian | Immigrants from Sudan |
| Minimum | 5.2% | 4.7% |
| Maximum | 17.5% | 22.1% |
| Range | 12.2% | 17.5% |
| Mean | 12.1% | 10.7% |
| Median | 12.2% | 10.2% |
| Interquartile 25% (IQ1) | 10.8% | 8.6% |
| Interquartile 75% (IQ3) | 13.5% | 12.3% |
| Interquartile Range (IQR) | 2.7% | 3.7% |
| Standard Deviation (Sample) | 2.5% | 3.2% |
| Standard Deviation (Population) | 2.5% | 3.2% |
Similar Demographics by Male Disability
Demographics Similar to Indonesians by Male Disability
In terms of male disability, the demographic groups most similar to Indonesians are Lithuanian (11.6%, a difference of 0.16%), Immigrants from Dominican Republic (11.7%, a difference of 0.28%), Immigrants from Dominica (11.7%, a difference of 0.34%), Mexican American Indian (11.6%, a difference of 0.40%), and Immigrants from Scotland (11.6%, a difference of 0.48%).
| Demographics | Rating | Rank | Male Disability |
| Icelanders | 10.1 /100 | #208 | Poor 11.6% |
| Spanish American Indians | 10.1 /100 | #209 | Poor 11.6% |
| Ute | 9.4 /100 | #210 | Tragic 11.6% |
| Immigrants | Thailand | 8.4 /100 | #211 | Tragic 11.6% |
| Immigrants | Scotland | 8.2 /100 | #212 | Tragic 11.6% |
| Mexican American Indians | 7.8 /100 | #213 | Tragic 11.6% |
| Lithuanians | 6.6 /100 | #214 | Tragic 11.6% |
| Indonesians | 5.9 /100 | #215 | Tragic 11.6% |
| Immigrants | Dominican Republic | 4.9 /100 | #216 | Tragic 11.7% |
| Immigrants | Dominica | 4.6 /100 | #217 | Tragic 11.7% |
| Immigrants | England | 4.0 /100 | #218 | Tragic 11.7% |
| Panamanians | 3.8 /100 | #219 | Tragic 11.7% |
| Immigrants | Western Europe | 3.8 /100 | #220 | Tragic 11.7% |
| Immigrants | Congo | 3.7 /100 | #221 | Tragic 11.7% |
| Alsatians | 3.3 /100 | #222 | Tragic 11.7% |
Demographics Similar to Immigrants from Sudan by Male Disability
In terms of male disability, the demographic groups most similar to Immigrants from Sudan are Immigrants from Italy (11.0%, a difference of 0.0%), Arab (11.0%, a difference of 0.0%), South African (11.0%, a difference of 0.020%), Nigerian (11.0%, a difference of 0.040%), and Immigrants from Europe (11.0%, a difference of 0.050%).
| Demographics | Rating | Rank | Male Disability |
| Trinidadians and Tobagonians | 83.3 /100 | #135 | Excellent 11.0% |
| Immigrants | Costa Rica | 82.8 /100 | #136 | Excellent 11.0% |
| Immigrants | Europe | 82.0 /100 | #137 | Excellent 11.0% |
| Nigerians | 81.9 /100 | #138 | Excellent 11.0% |
| South Africans | 81.7 /100 | #139 | Excellent 11.0% |
| Immigrants | Italy | 81.5 /100 | #140 | Excellent 11.0% |
| Arabs | 81.5 /100 | #141 | Excellent 11.0% |
| Immigrants | Sudan | 81.5 /100 | #142 | Excellent 11.0% |
| Moroccans | 80.7 /100 | #143 | Excellent 11.0% |
| Kenyans | 78.1 /100 | #144 | Good 11.0% |
| Costa Ricans | 78.0 /100 | #145 | Good 11.0% |
| Koreans | 77.5 /100 | #146 | Good 11.0% |
| Immigrants | Croatia | 77.3 /100 | #147 | Good 11.0% |
| Sudanese | 77.1 /100 | #148 | Good 11.0% |
| Immigrants | Denmark | 76.4 /100 | #149 | Good 11.0% |