Finnish vs Immigrants from Taiwan Vision Disability
COMPARE
Finnish
Immigrants from Taiwan
Vision Disability
Vision Disability Comparison
Finns
Immigrants from Taiwan
2.1%
VISION DISABILITY
78.3/ 100
METRIC RATING
148th/ 347
METRIC RANK
1.7%
VISION DISABILITY
100.0/ 100
METRIC RATING
3rd/ 347
METRIC RANK
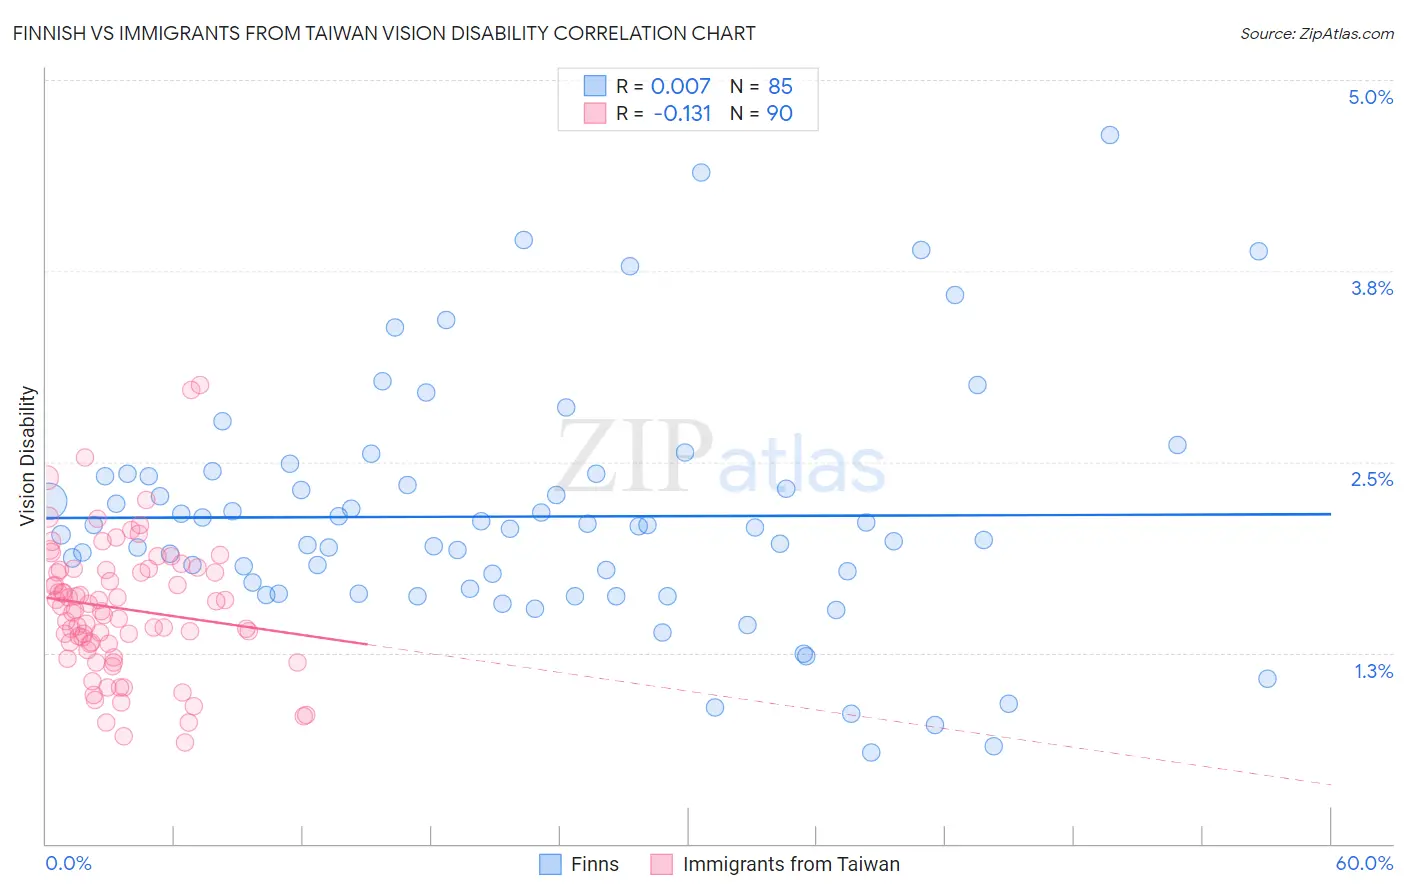
Finnish vs Immigrants from Taiwan Vision Disability Correlation Chart
The statistical analysis conducted on geographies consisting of 404,250,677 people shows no correlation between the proportion of Finns and percentage of population with vision disability in the United States with a correlation coefficient (R) of 0.007 and weighted average of 2.1%. Similarly, the statistical analysis conducted on geographies consisting of 298,112,915 people shows a poor negative correlation between the proportion of Immigrants from Taiwan and percentage of population with vision disability in the United States with a correlation coefficient (R) of -0.131 and weighted average of 1.7%, a difference of 25.2%.
Vision Disability Correlation Summary
| Measurement | Finnish | Immigrants from Taiwan |
| Minimum | 0.59% | 0.66% |
| Maximum | 4.6% | 3.0% |
| Range | 4.0% | 2.3% |
| Mean | 2.1% | 1.5% |
| Median | 2.1% | 1.5% |
| Interquartile 25% (IQ1) | 1.7% | 1.3% |
| Interquartile 75% (IQ3) | 2.4% | 1.8% |
| Interquartile Range (IQR) | 0.76% | 0.49% |
| Standard Deviation (Sample) | 0.79% | 0.44% |
| Standard Deviation (Population) | 0.79% | 0.44% |
Similar Demographics by Vision Disability
Demographics Similar to Finns by Vision Disability
In terms of vision disability, the demographic groups most similar to Finns are Immigrants from Sudan (2.1%, a difference of 0.010%), Italian (2.1%, a difference of 0.14%), Colombian (2.1%, a difference of 0.19%), Belgian (2.1%, a difference of 0.22%), and Immigrants from Norway (2.1%, a difference of 0.25%).
| Demographics | Rating | Rank | Vision Disability |
| Sierra Leoneans | 84.1 /100 | #141 | Excellent 2.1% |
| South Americans | 82.8 /100 | #142 | Excellent 2.1% |
| Immigrants | Sierra Leone | 82.8 /100 | #143 | Excellent 2.1% |
| Ukrainians | 81.9 /100 | #144 | Excellent 2.1% |
| Immigrants | Bosnia and Herzegovina | 81.5 /100 | #145 | Excellent 2.1% |
| Italians | 79.7 /100 | #146 | Good 2.1% |
| Immigrants | Sudan | 78.4 /100 | #147 | Good 2.1% |
| Finns | 78.3 /100 | #148 | Good 2.1% |
| Colombians | 76.2 /100 | #149 | Good 2.1% |
| Belgians | 75.9 /100 | #150 | Good 2.1% |
| Immigrants | Norway | 75.5 /100 | #151 | Good 2.1% |
| Immigrants | Southern Europe | 74.6 /100 | #152 | Good 2.1% |
| Immigrants | South America | 73.8 /100 | #153 | Good 2.1% |
| Slovenes | 73.6 /100 | #154 | Good 2.1% |
| Immigrants | Colombia | 72.1 /100 | #155 | Good 2.1% |
Demographics Similar to Immigrants from Taiwan by Vision Disability
In terms of vision disability, the demographic groups most similar to Immigrants from Taiwan are Filipino (1.7%, a difference of 0.65%), Immigrants from India (1.7%, a difference of 0.71%), Thai (1.7%, a difference of 2.6%), Okinawan (1.8%, a difference of 4.6%), and Immigrants from Iran (1.8%, a difference of 5.2%).
| Demographics | Rating | Rank | Vision Disability |
| Immigrants | India | 100.0 /100 | #1 | Exceptional 1.7% |
| Filipinos | 100.0 /100 | #2 | Exceptional 1.7% |
| Immigrants | Taiwan | 100.0 /100 | #3 | Exceptional 1.7% |
| Thais | 100.0 /100 | #4 | Exceptional 1.7% |
| Okinawans | 100.0 /100 | #5 | Exceptional 1.8% |
| Immigrants | Iran | 100.0 /100 | #6 | Exceptional 1.8% |
| Immigrants | South Central Asia | 100.0 /100 | #7 | Exceptional 1.8% |
| Iranians | 100.0 /100 | #8 | Exceptional 1.8% |
| Immigrants | Singapore | 100.0 /100 | #9 | Exceptional 1.8% |
| Immigrants | Hong Kong | 100.0 /100 | #10 | Exceptional 1.8% |
| Immigrants | Israel | 100.0 /100 | #11 | Exceptional 1.8% |
| Immigrants | Korea | 100.0 /100 | #12 | Exceptional 1.8% |
| Immigrants | Eastern Asia | 100.0 /100 | #13 | Exceptional 1.8% |
| Immigrants | China | 100.0 /100 | #14 | Exceptional 1.8% |
| Immigrants | Bolivia | 100.0 /100 | #15 | Exceptional 1.8% |