Immigrants from Venezuela vs Immigrants from Taiwan Vision Disability
COMPARE
Immigrants from Venezuela
Immigrants from Taiwan
Vision Disability
Vision Disability Comparison
Immigrants from Venezuela
Immigrants from Taiwan
2.1%
VISION DISABILITY
89.8/ 100
METRIC RATING
125th/ 347
METRIC RANK
1.7%
VISION DISABILITY
100.0/ 100
METRIC RATING
3rd/ 347
METRIC RANK
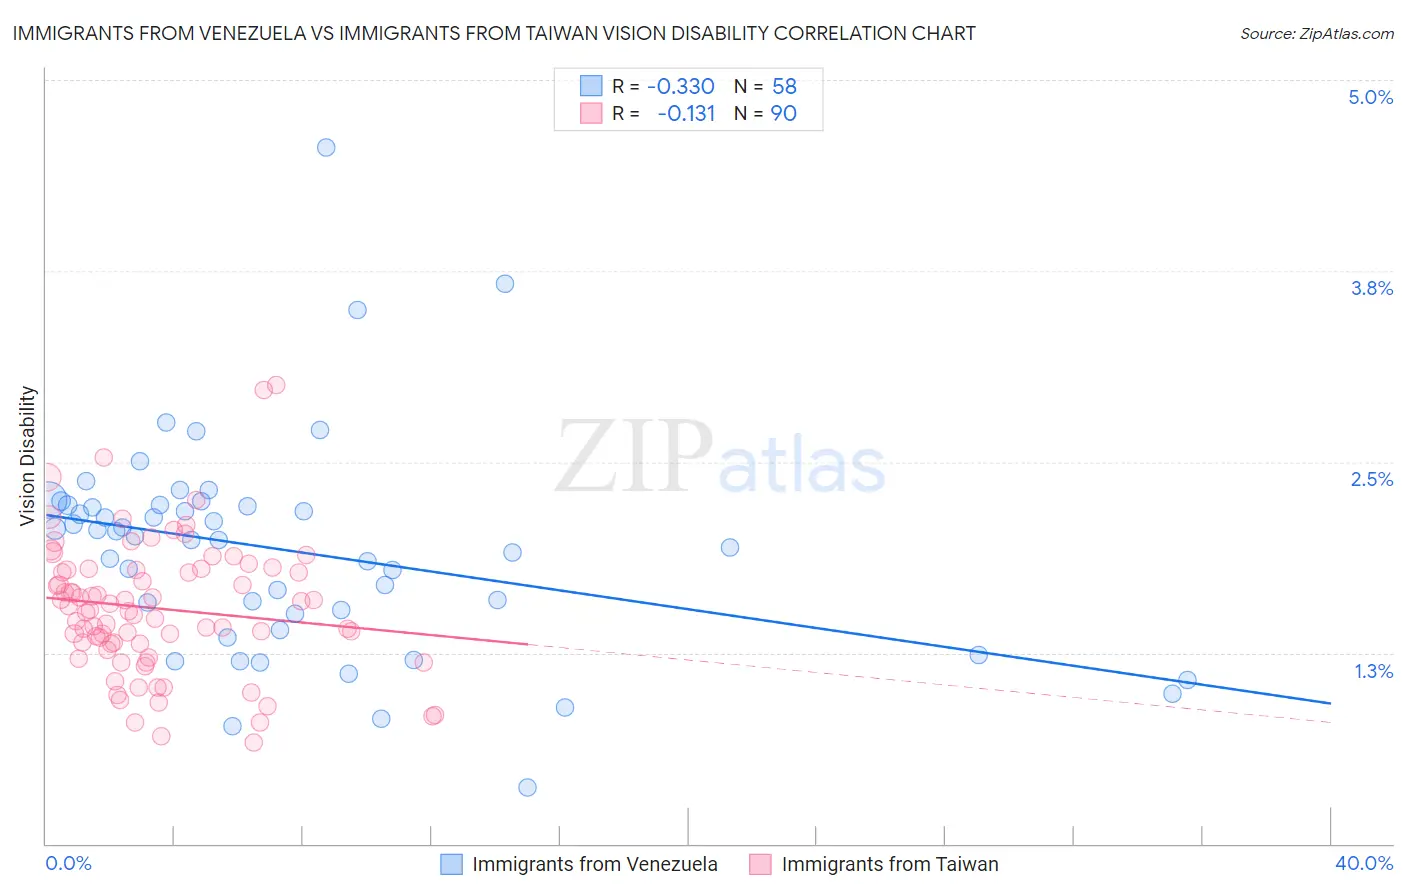
Immigrants from Venezuela vs Immigrants from Taiwan Vision Disability Correlation Chart
The statistical analysis conducted on geographies consisting of 287,771,852 people shows a mild negative correlation between the proportion of Immigrants from Venezuela and percentage of population with vision disability in the United States with a correlation coefficient (R) of -0.330 and weighted average of 2.1%. Similarly, the statistical analysis conducted on geographies consisting of 298,112,915 people shows a poor negative correlation between the proportion of Immigrants from Taiwan and percentage of population with vision disability in the United States with a correlation coefficient (R) of -0.131 and weighted average of 1.7%, a difference of 23.4%.
Vision Disability Correlation Summary
| Measurement | Immigrants from Venezuela | Immigrants from Taiwan |
| Minimum | 0.36% | 0.66% |
| Maximum | 4.6% | 3.0% |
| Range | 4.2% | 2.3% |
| Mean | 1.9% | 1.5% |
| Median | 2.0% | 1.5% |
| Interquartile 25% (IQ1) | 1.5% | 1.3% |
| Interquartile 75% (IQ3) | 2.2% | 1.8% |
| Interquartile Range (IQR) | 0.71% | 0.49% |
| Standard Deviation (Sample) | 0.71% | 0.44% |
| Standard Deviation (Population) | 0.70% | 0.44% |
Similar Demographics by Vision Disability
Demographics Similar to Immigrants from Venezuela by Vision Disability
In terms of vision disability, the demographic groups most similar to Immigrants from Venezuela are Immigrants from Spain (2.1%, a difference of 0.0%), Immigrants from Peru (2.1%, a difference of 0.040%), Sudanese (2.1%, a difference of 0.10%), Immigrants from Ukraine (2.1%, a difference of 0.11%), and Immigrants from Albania (2.1%, a difference of 0.11%).
| Demographics | Rating | Rank | Vision Disability |
| Immigrants | Philippines | 91.4 /100 | #118 | Exceptional 2.1% |
| Immigrants | Uganda | 91.4 /100 | #119 | Exceptional 2.1% |
| Immigrants | Zimbabwe | 91.0 /100 | #120 | Exceptional 2.1% |
| Immigrants | Scotland | 90.4 /100 | #121 | Exceptional 2.1% |
| Immigrants | Ukraine | 90.4 /100 | #122 | Exceptional 2.1% |
| Immigrants | Albania | 90.4 /100 | #123 | Exceptional 2.1% |
| Immigrants | Spain | 89.8 /100 | #124 | Excellent 2.1% |
| Immigrants | Venezuela | 89.8 /100 | #125 | Excellent 2.1% |
| Immigrants | Peru | 89.5 /100 | #126 | Excellent 2.1% |
| Sudanese | 89.2 /100 | #127 | Excellent 2.1% |
| Immigrants | Chile | 89.0 /100 | #128 | Excellent 2.1% |
| Immigrants | Cameroon | 88.8 /100 | #129 | Excellent 2.1% |
| Immigrants | Kenya | 88.7 /100 | #130 | Excellent 2.1% |
| Immigrants | Hungary | 88.7 /100 | #131 | Excellent 2.1% |
| New Zealanders | 88.2 /100 | #132 | Excellent 2.1% |
Demographics Similar to Immigrants from Taiwan by Vision Disability
In terms of vision disability, the demographic groups most similar to Immigrants from Taiwan are Filipino (1.7%, a difference of 0.65%), Immigrants from India (1.7%, a difference of 0.71%), Thai (1.7%, a difference of 2.6%), Okinawan (1.8%, a difference of 4.6%), and Immigrants from Iran (1.8%, a difference of 5.2%).
| Demographics | Rating | Rank | Vision Disability |
| Immigrants | India | 100.0 /100 | #1 | Exceptional 1.7% |
| Filipinos | 100.0 /100 | #2 | Exceptional 1.7% |
| Immigrants | Taiwan | 100.0 /100 | #3 | Exceptional 1.7% |
| Thais | 100.0 /100 | #4 | Exceptional 1.7% |
| Okinawans | 100.0 /100 | #5 | Exceptional 1.8% |
| Immigrants | Iran | 100.0 /100 | #6 | Exceptional 1.8% |
| Immigrants | South Central Asia | 100.0 /100 | #7 | Exceptional 1.8% |
| Iranians | 100.0 /100 | #8 | Exceptional 1.8% |
| Immigrants | Singapore | 100.0 /100 | #9 | Exceptional 1.8% |
| Immigrants | Hong Kong | 100.0 /100 | #10 | Exceptional 1.8% |
| Immigrants | Israel | 100.0 /100 | #11 | Exceptional 1.8% |
| Immigrants | Korea | 100.0 /100 | #12 | Exceptional 1.8% |
| Immigrants | Eastern Asia | 100.0 /100 | #13 | Exceptional 1.8% |
| Immigrants | China | 100.0 /100 | #14 | Exceptional 1.8% |
| Immigrants | Bolivia | 100.0 /100 | #15 | Exceptional 1.8% |