Indonesian vs Immigrants from Morocco Cognitive Disability
COMPARE
Indonesian
Immigrants from Morocco
Cognitive Disability
Cognitive Disability Comparison
Indonesians
Immigrants from Morocco
18.7%
COGNITIVE DISABILITY
0.0/ 100
METRIC RATING
325th/ 347
METRIC RANK
17.5%
COGNITIVE DISABILITY
12.0/ 100
METRIC RATING
202nd/ 347
METRIC RANK
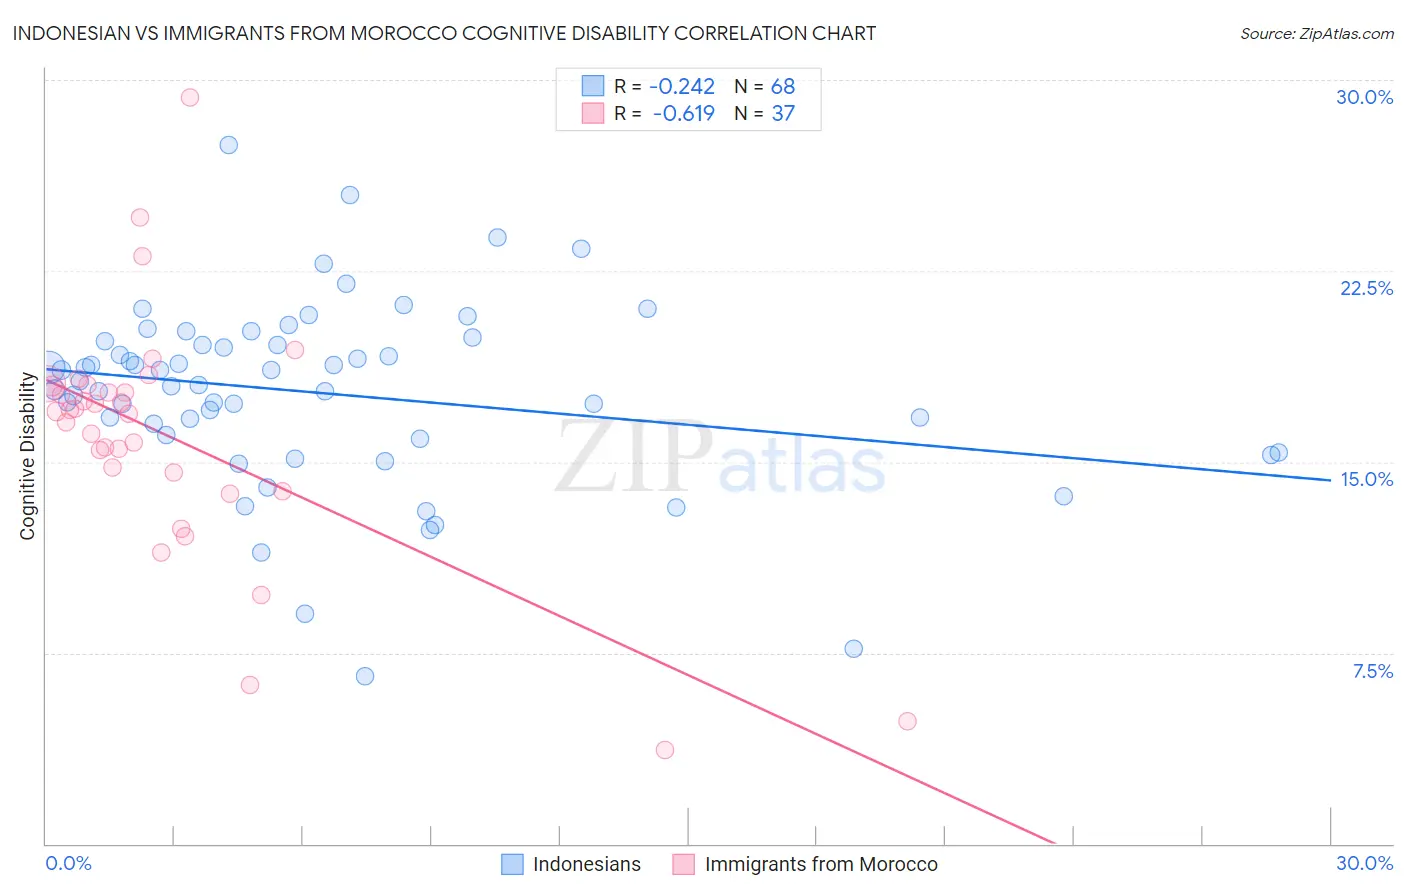
Indonesian vs Immigrants from Morocco Cognitive Disability Correlation Chart
The statistical analysis conducted on geographies consisting of 162,728,368 people shows a weak negative correlation between the proportion of Indonesians and percentage of population with cognitive disability in the United States with a correlation coefficient (R) of -0.242 and weighted average of 18.7%. Similarly, the statistical analysis conducted on geographies consisting of 178,912,345 people shows a significant negative correlation between the proportion of Immigrants from Morocco and percentage of population with cognitive disability in the United States with a correlation coefficient (R) of -0.619 and weighted average of 17.5%, a difference of 6.7%.
Cognitive Disability Correlation Summary
| Measurement | Indonesian | Immigrants from Morocco |
| Minimum | 6.6% | 3.7% |
| Maximum | 27.5% | 29.3% |
| Range | 20.9% | 25.6% |
| Mean | 17.7% | 16.0% |
| Median | 18.1% | 17.0% |
| Interquartile 25% (IQ1) | 16.0% | 14.2% |
| Interquartile 75% (IQ3) | 19.7% | 18.0% |
| Interquartile Range (IQR) | 3.7% | 3.8% |
| Standard Deviation (Sample) | 3.7% | 4.8% |
| Standard Deviation (Population) | 3.7% | 4.8% |
Similar Demographics by Cognitive Disability
Demographics Similar to Indonesians by Cognitive Disability
In terms of cognitive disability, the demographic groups most similar to Indonesians are Immigrants from Senegal (18.7%, a difference of 0.020%), U.S. Virgin Islander (18.7%, a difference of 0.060%), Dominican (18.7%, a difference of 0.080%), Kiowa (18.7%, a difference of 0.12%), and Pueblo (18.7%, a difference of 0.20%).
| Demographics | Rating | Rank | Cognitive Disability |
| Bangladeshis | 0.0 /100 | #318 | Tragic 18.6% |
| Comanche | 0.0 /100 | #319 | Tragic 18.6% |
| Apache | 0.0 /100 | #320 | Tragic 18.6% |
| Africans | 0.0 /100 | #321 | Tragic 18.6% |
| Immigrants | Liberia | 0.0 /100 | #322 | Tragic 18.7% |
| Pueblo | 0.0 /100 | #323 | Tragic 18.7% |
| Dominicans | 0.0 /100 | #324 | Tragic 18.7% |
| Indonesians | 0.0 /100 | #325 | Tragic 18.7% |
| Immigrants | Senegal | 0.0 /100 | #326 | Tragic 18.7% |
| U.S. Virgin Islanders | 0.0 /100 | #327 | Tragic 18.7% |
| Kiowa | 0.0 /100 | #328 | Tragic 18.7% |
| Navajo | 0.0 /100 | #329 | Tragic 18.8% |
| Immigrants | Dominican Republic | 0.0 /100 | #330 | Tragic 18.8% |
| Pima | 0.0 /100 | #331 | Tragic 18.8% |
| Immigrants | Sudan | 0.0 /100 | #332 | Tragic 18.8% |
Demographics Similar to Immigrants from Morocco by Cognitive Disability
In terms of cognitive disability, the demographic groups most similar to Immigrants from Morocco are South American Indian (17.5%, a difference of 0.060%), Immigrants from Caribbean (17.5%, a difference of 0.070%), Immigrants from Zimbabwe (17.5%, a difference of 0.070%), Puget Sound Salish (17.5%, a difference of 0.080%), and Alaska Native (17.5%, a difference of 0.12%).
| Demographics | Rating | Rank | Cognitive Disability |
| New Zealanders | 21.1 /100 | #195 | Fair 17.4% |
| Guyanese | 17.5 /100 | #196 | Poor 17.5% |
| Immigrants | Afghanistan | 16.7 /100 | #197 | Poor 17.5% |
| Immigrants | Panama | 14.8 /100 | #198 | Poor 17.5% |
| Immigrants | Singapore | 14.3 /100 | #199 | Poor 17.5% |
| Haitians | 14.1 /100 | #200 | Poor 17.5% |
| South American Indians | 13.0 /100 | #201 | Poor 17.5% |
| Immigrants | Morocco | 12.0 /100 | #202 | Poor 17.5% |
| Immigrants | Caribbean | 11.0 /100 | #203 | Poor 17.5% |
| Immigrants | Zimbabwe | 11.0 /100 | #204 | Poor 17.5% |
| Puget Sound Salish | 10.9 /100 | #205 | Poor 17.5% |
| Alaska Natives | 10.4 /100 | #206 | Poor 17.5% |
| Immigrants | Latin America | 9.7 /100 | #207 | Tragic 17.6% |
| Immigrants | Cameroon | 9.3 /100 | #208 | Tragic 17.6% |
| Immigrants | Trinidad and Tobago | 8.7 /100 | #209 | Tragic 17.6% |