Indonesian vs Fijian Cognitive Disability
COMPARE
Indonesian
Fijian
Cognitive Disability
Cognitive Disability Comparison
Indonesians
Fijians
18.7%
COGNITIVE DISABILITY
0.0/ 100
METRIC RATING
325th/ 347
METRIC RANK
17.7%
COGNITIVE DISABILITY
3.4/ 100
METRIC RATING
224th/ 347
METRIC RANK
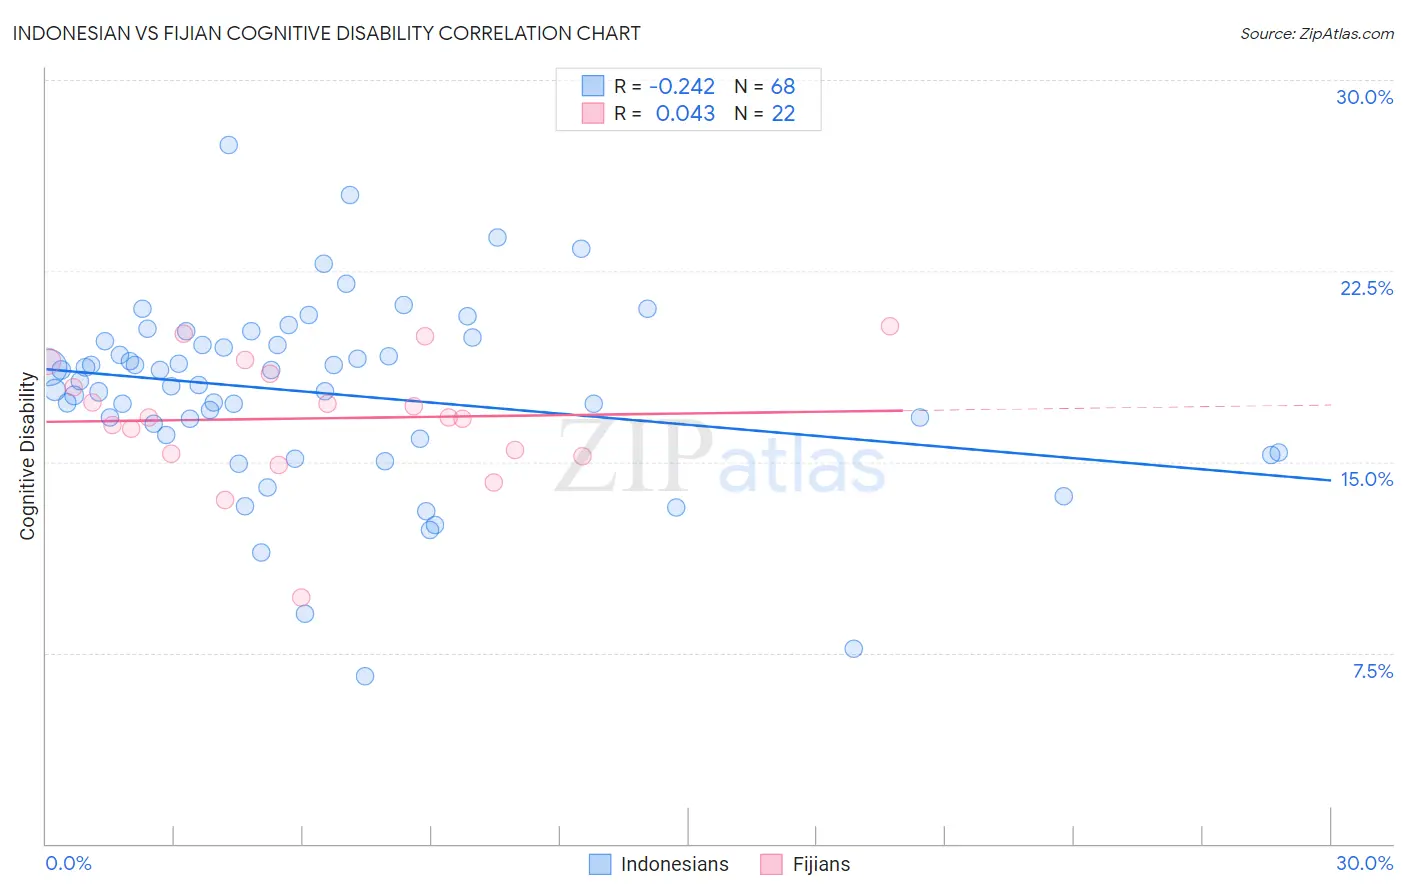
Indonesian vs Fijian Cognitive Disability Correlation Chart
The statistical analysis conducted on geographies consisting of 162,728,368 people shows a weak negative correlation between the proportion of Indonesians and percentage of population with cognitive disability in the United States with a correlation coefficient (R) of -0.242 and weighted average of 18.7%. Similarly, the statistical analysis conducted on geographies consisting of 55,934,490 people shows no correlation between the proportion of Fijians and percentage of population with cognitive disability in the United States with a correlation coefficient (R) of 0.043 and weighted average of 17.7%, a difference of 5.7%.
Cognitive Disability Correlation Summary
| Measurement | Indonesian | Fijian |
| Minimum | 6.6% | 9.7% |
| Maximum | 27.5% | 20.3% |
| Range | 20.9% | 10.6% |
| Mean | 17.7% | 16.7% |
| Median | 18.1% | 16.7% |
| Interquartile 25% (IQ1) | 16.0% | 15.3% |
| Interquartile 75% (IQ3) | 19.7% | 18.4% |
| Interquartile Range (IQR) | 3.7% | 3.1% |
| Standard Deviation (Sample) | 3.7% | 2.4% |
| Standard Deviation (Population) | 3.7% | 2.4% |
Similar Demographics by Cognitive Disability
Demographics Similar to Indonesians by Cognitive Disability
In terms of cognitive disability, the demographic groups most similar to Indonesians are Immigrants from Senegal (18.7%, a difference of 0.020%), U.S. Virgin Islander (18.7%, a difference of 0.060%), Dominican (18.7%, a difference of 0.080%), Kiowa (18.7%, a difference of 0.12%), and Pueblo (18.7%, a difference of 0.20%).
| Demographics | Rating | Rank | Cognitive Disability |
| Bangladeshis | 0.0 /100 | #318 | Tragic 18.6% |
| Comanche | 0.0 /100 | #319 | Tragic 18.6% |
| Apache | 0.0 /100 | #320 | Tragic 18.6% |
| Africans | 0.0 /100 | #321 | Tragic 18.6% |
| Immigrants | Liberia | 0.0 /100 | #322 | Tragic 18.7% |
| Pueblo | 0.0 /100 | #323 | Tragic 18.7% |
| Dominicans | 0.0 /100 | #324 | Tragic 18.7% |
| Indonesians | 0.0 /100 | #325 | Tragic 18.7% |
| Immigrants | Senegal | 0.0 /100 | #326 | Tragic 18.7% |
| U.S. Virgin Islanders | 0.0 /100 | #327 | Tragic 18.7% |
| Kiowa | 0.0 /100 | #328 | Tragic 18.7% |
| Navajo | 0.0 /100 | #329 | Tragic 18.8% |
| Immigrants | Dominican Republic | 0.0 /100 | #330 | Tragic 18.8% |
| Pima | 0.0 /100 | #331 | Tragic 18.8% |
| Immigrants | Sudan | 0.0 /100 | #332 | Tragic 18.8% |
Demographics Similar to Fijians by Cognitive Disability
In terms of cognitive disability, the demographic groups most similar to Fijians are Vietnamese (17.7%, a difference of 0.010%), Marshallese (17.7%, a difference of 0.17%), Alsatian (17.7%, a difference of 0.19%), Central American (17.7%, a difference of 0.20%), and Immigrants from St. Vincent and the Grenadines (17.7%, a difference of 0.20%).
| Demographics | Rating | Rank | Cognitive Disability |
| Salvadorans | 6.7 /100 | #217 | Tragic 17.6% |
| Icelanders | 6.4 /100 | #218 | Tragic 17.6% |
| Immigrants | Sierra Leone | 6.3 /100 | #219 | Tragic 17.6% |
| Zimbabweans | 6.1 /100 | #220 | Tragic 17.6% |
| Moroccans | 5.9 /100 | #221 | Tragic 17.6% |
| Central Americans | 4.5 /100 | #222 | Tragic 17.7% |
| Alsatians | 4.5 /100 | #223 | Tragic 17.7% |
| Fijians | 3.4 /100 | #224 | Tragic 17.7% |
| Vietnamese | 3.4 /100 | #225 | Tragic 17.7% |
| Marshallese | 2.7 /100 | #226 | Tragic 17.7% |
| Immigrants | St. Vincent and the Grenadines | 2.6 /100 | #227 | Tragic 17.7% |
| Immigrants | Central America | 2.3 /100 | #228 | Tragic 17.7% |
| Immigrants | Guatemala | 2.2 /100 | #229 | Tragic 17.7% |
| Mongolians | 2.2 /100 | #230 | Tragic 17.7% |
| Guatemalans | 2.1 /100 | #231 | Tragic 17.8% |