Indonesian vs Bulgarian Cognitive Disability
COMPARE
Indonesian
Bulgarian
Cognitive Disability
Cognitive Disability Comparison
Indonesians
Bulgarians
18.7%
COGNITIVE DISABILITY
0.0/ 100
METRIC RATING
325th/ 347
METRIC RANK
16.3%
COGNITIVE DISABILITY
100.0/ 100
METRIC RATING
20th/ 347
METRIC RANK
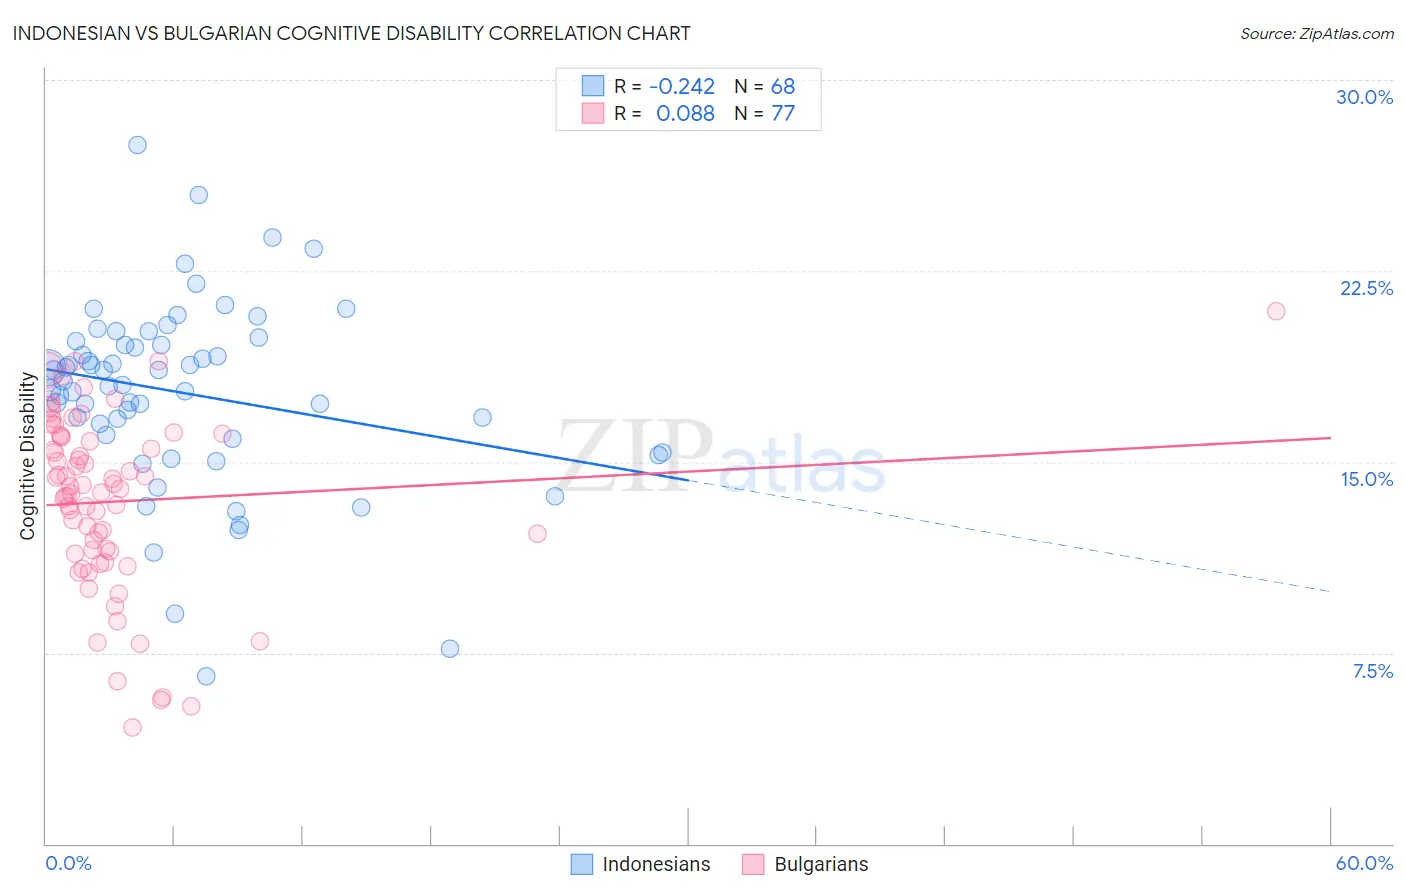
Indonesian vs Bulgarian Cognitive Disability Correlation Chart
The statistical analysis conducted on geographies consisting of 162,728,368 people shows a weak negative correlation between the proportion of Indonesians and percentage of population with cognitive disability in the United States with a correlation coefficient (R) of -0.242 and weighted average of 18.7%. Similarly, the statistical analysis conducted on geographies consisting of 205,630,797 people shows a slight positive correlation between the proportion of Bulgarians and percentage of population with cognitive disability in the United States with a correlation coefficient (R) of 0.088 and weighted average of 16.3%, a difference of 14.5%.
Cognitive Disability Correlation Summary
| Measurement | Indonesian | Bulgarian |
| Minimum | 6.6% | 4.6% |
| Maximum | 27.5% | 20.9% |
| Range | 20.9% | 16.4% |
| Mean | 17.7% | 13.4% |
| Median | 18.1% | 14.0% |
| Interquartile 25% (IQ1) | 16.0% | 11.4% |
| Interquartile 75% (IQ3) | 19.7% | 16.0% |
| Interquartile Range (IQR) | 3.7% | 4.6% |
| Standard Deviation (Sample) | 3.7% | 3.4% |
| Standard Deviation (Population) | 3.7% | 3.4% |
Similar Demographics by Cognitive Disability
Demographics Similar to Indonesians by Cognitive Disability
In terms of cognitive disability, the demographic groups most similar to Indonesians are Immigrants from Senegal (18.7%, a difference of 0.020%), U.S. Virgin Islander (18.7%, a difference of 0.060%), Dominican (18.7%, a difference of 0.080%), Kiowa (18.7%, a difference of 0.12%), and Pueblo (18.7%, a difference of 0.20%).
| Demographics | Rating | Rank | Cognitive Disability |
| Bangladeshis | 0.0 /100 | #318 | Tragic 18.6% |
| Comanche | 0.0 /100 | #319 | Tragic 18.6% |
| Apache | 0.0 /100 | #320 | Tragic 18.6% |
| Africans | 0.0 /100 | #321 | Tragic 18.6% |
| Immigrants | Liberia | 0.0 /100 | #322 | Tragic 18.7% |
| Pueblo | 0.0 /100 | #323 | Tragic 18.7% |
| Dominicans | 0.0 /100 | #324 | Tragic 18.7% |
| Indonesians | 0.0 /100 | #325 | Tragic 18.7% |
| Immigrants | Senegal | 0.0 /100 | #326 | Tragic 18.7% |
| U.S. Virgin Islanders | 0.0 /100 | #327 | Tragic 18.7% |
| Kiowa | 0.0 /100 | #328 | Tragic 18.7% |
| Navajo | 0.0 /100 | #329 | Tragic 18.8% |
| Immigrants | Dominican Republic | 0.0 /100 | #330 | Tragic 18.8% |
| Pima | 0.0 /100 | #331 | Tragic 18.8% |
| Immigrants | Sudan | 0.0 /100 | #332 | Tragic 18.8% |
Demographics Similar to Bulgarians by Cognitive Disability
In terms of cognitive disability, the demographic groups most similar to Bulgarians are Immigrants from Bolivia (16.3%, a difference of 0.010%), Immigrants from Northern Europe (16.3%, a difference of 0.020%), Immigrants from Cuba (16.3%, a difference of 0.040%), Immigrants from North Macedonia (16.3%, a difference of 0.080%), and Eastern European (16.3%, a difference of 0.10%).
| Demographics | Rating | Rank | Cognitive Disability |
| Lithuanians | 100.0 /100 | #13 | Exceptional 16.3% |
| Immigrants | Austria | 100.0 /100 | #14 | Exceptional 16.3% |
| Immigrants | Greece | 100.0 /100 | #15 | Exceptional 16.3% |
| Eastern Europeans | 100.0 /100 | #16 | Exceptional 16.3% |
| Immigrants | North Macedonia | 100.0 /100 | #17 | Exceptional 16.3% |
| Immigrants | Northern Europe | 100.0 /100 | #18 | Exceptional 16.3% |
| Immigrants | Bolivia | 100.0 /100 | #19 | Exceptional 16.3% |
| Bulgarians | 100.0 /100 | #20 | Exceptional 16.3% |
| Immigrants | Cuba | 100.0 /100 | #21 | Exceptional 16.3% |
| Immigrants | South Central Asia | 99.9 /100 | #22 | Exceptional 16.4% |
| Croatians | 99.9 /100 | #23 | Exceptional 16.4% |
| Immigrants | Argentina | 99.9 /100 | #24 | Exceptional 16.4% |
| Luxembourgers | 99.9 /100 | #25 | Exceptional 16.4% |
| Immigrants | Croatia | 99.9 /100 | #26 | Exceptional 16.4% |
| Immigrants | Pakistan | 99.9 /100 | #27 | Exceptional 16.4% |