Immigrants from Kazakhstan vs Immigrants from Morocco Cognitive Disability
COMPARE
Immigrants from Kazakhstan
Immigrants from Morocco
Cognitive Disability
Cognitive Disability Comparison
Immigrants from Kazakhstan
Immigrants from Morocco
17.1%
COGNITIVE DISABILITY
80.5/ 100
METRIC RATING
153rd/ 347
METRIC RANK
17.5%
COGNITIVE DISABILITY
12.0/ 100
METRIC RATING
202nd/ 347
METRIC RANK
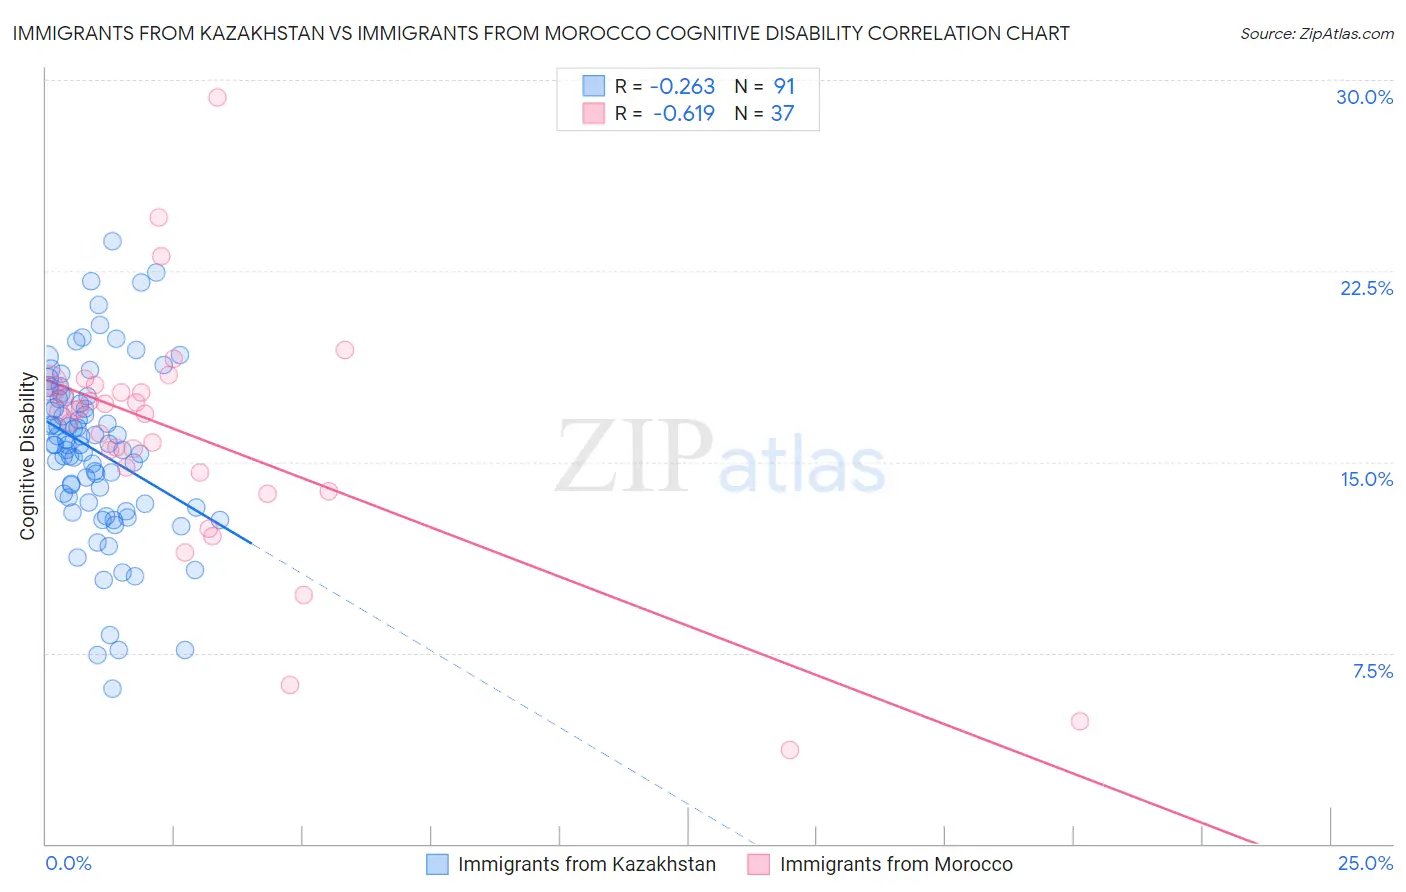
Immigrants from Kazakhstan vs Immigrants from Morocco Cognitive Disability Correlation Chart
The statistical analysis conducted on geographies consisting of 124,443,744 people shows a weak negative correlation between the proportion of Immigrants from Kazakhstan and percentage of population with cognitive disability in the United States with a correlation coefficient (R) of -0.263 and weighted average of 17.1%. Similarly, the statistical analysis conducted on geographies consisting of 178,912,345 people shows a significant negative correlation between the proportion of Immigrants from Morocco and percentage of population with cognitive disability in the United States with a correlation coefficient (R) of -0.619 and weighted average of 17.5%, a difference of 2.5%.
Cognitive Disability Correlation Summary
| Measurement | Immigrants from Kazakhstan | Immigrants from Morocco |
| Minimum | 6.1% | 3.7% |
| Maximum | 23.7% | 29.3% |
| Range | 17.6% | 25.6% |
| Mean | 15.5% | 16.0% |
| Median | 15.7% | 17.0% |
| Interquartile 25% (IQ1) | 13.4% | 14.2% |
| Interquartile 75% (IQ3) | 17.5% | 18.0% |
| Interquartile Range (IQR) | 4.2% | 3.8% |
| Standard Deviation (Sample) | 3.4% | 4.8% |
| Standard Deviation (Population) | 3.4% | 4.8% |
Similar Demographics by Cognitive Disability
Demographics Similar to Immigrants from Kazakhstan by Cognitive Disability
In terms of cognitive disability, the demographic groups most similar to Immigrants from Kazakhstan are Immigrants from Malaysia (17.1%, a difference of 0.050%), Brazilian (17.1%, a difference of 0.070%), Sri Lankan (17.1%, a difference of 0.070%), Immigrants from Indonesia (17.1%, a difference of 0.10%), and Syrian (17.1%, a difference of 0.12%).
| Demographics | Rating | Rank | Cognitive Disability |
| Costa Ricans | 88.0 /100 | #146 | Excellent 17.0% |
| Scotch-Irish | 85.9 /100 | #147 | Excellent 17.1% |
| French Canadians | 85.7 /100 | #148 | Excellent 17.1% |
| Cypriots | 85.7 /100 | #149 | Excellent 17.1% |
| Basques | 85.5 /100 | #150 | Excellent 17.1% |
| Syrians | 83.0 /100 | #151 | Excellent 17.1% |
| Immigrants | Indonesia | 82.7 /100 | #152 | Excellent 17.1% |
| Immigrants | Kazakhstan | 80.5 /100 | #153 | Excellent 17.1% |
| Immigrants | Malaysia | 79.3 /100 | #154 | Good 17.1% |
| Brazilians | 78.9 /100 | #155 | Good 17.1% |
| Sri Lankans | 78.9 /100 | #156 | Good 17.1% |
| Immigrants | Australia | 76.0 /100 | #157 | Good 17.1% |
| Celtics | 74.1 /100 | #158 | Good 17.1% |
| Immigrants | Latvia | 73.2 /100 | #159 | Good 17.2% |
| Australians | 72.4 /100 | #160 | Good 17.2% |
Demographics Similar to Immigrants from Morocco by Cognitive Disability
In terms of cognitive disability, the demographic groups most similar to Immigrants from Morocco are South American Indian (17.5%, a difference of 0.060%), Immigrants from Caribbean (17.5%, a difference of 0.070%), Immigrants from Zimbabwe (17.5%, a difference of 0.070%), Puget Sound Salish (17.5%, a difference of 0.080%), and Alaska Native (17.5%, a difference of 0.12%).
| Demographics | Rating | Rank | Cognitive Disability |
| New Zealanders | 21.1 /100 | #195 | Fair 17.4% |
| Guyanese | 17.5 /100 | #196 | Poor 17.5% |
| Immigrants | Afghanistan | 16.7 /100 | #197 | Poor 17.5% |
| Immigrants | Panama | 14.8 /100 | #198 | Poor 17.5% |
| Immigrants | Singapore | 14.3 /100 | #199 | Poor 17.5% |
| Haitians | 14.1 /100 | #200 | Poor 17.5% |
| South American Indians | 13.0 /100 | #201 | Poor 17.5% |
| Immigrants | Morocco | 12.0 /100 | #202 | Poor 17.5% |
| Immigrants | Caribbean | 11.0 /100 | #203 | Poor 17.5% |
| Immigrants | Zimbabwe | 11.0 /100 | #204 | Poor 17.5% |
| Puget Sound Salish | 10.9 /100 | #205 | Poor 17.5% |
| Alaska Natives | 10.4 /100 | #206 | Poor 17.5% |
| Immigrants | Latin America | 9.7 /100 | #207 | Tragic 17.6% |
| Immigrants | Cameroon | 9.3 /100 | #208 | Tragic 17.6% |
| Immigrants | Trinidad and Tobago | 8.7 /100 | #209 | Tragic 17.6% |