Indonesian vs Immigrants from Hungary Cognitive Disability
COMPARE
Indonesian
Immigrants from Hungary
Cognitive Disability
Cognitive Disability Comparison
Indonesians
Immigrants from Hungary
18.7%
COGNITIVE DISABILITY
0.0/ 100
METRIC RATING
325th/ 347
METRIC RANK
16.7%
COGNITIVE DISABILITY
99.3/ 100
METRIC RATING
77th/ 347
METRIC RANK
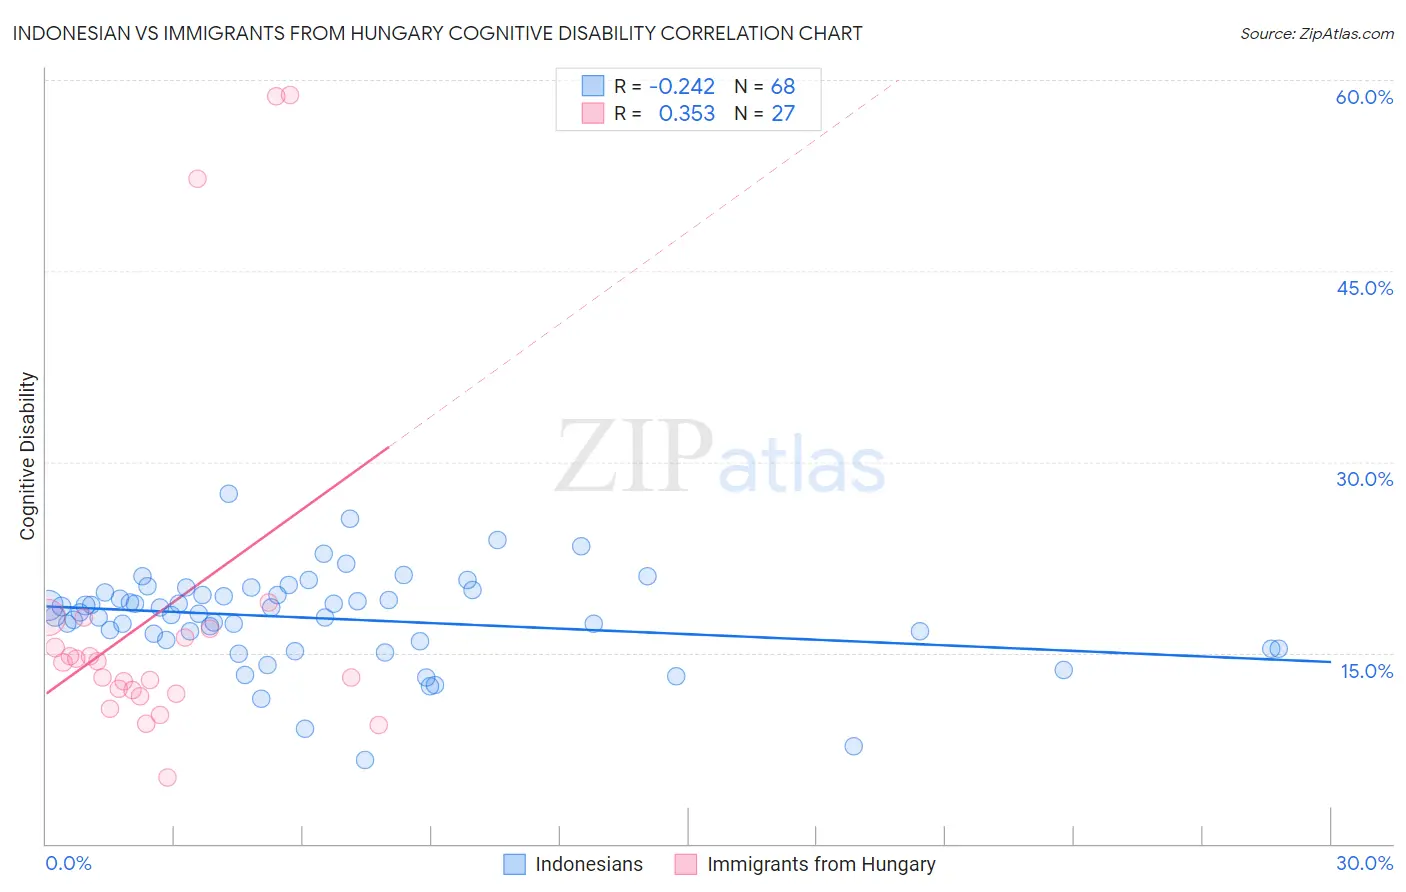
Indonesian vs Immigrants from Hungary Cognitive Disability Correlation Chart
The statistical analysis conducted on geographies consisting of 162,728,368 people shows a weak negative correlation between the proportion of Indonesians and percentage of population with cognitive disability in the United States with a correlation coefficient (R) of -0.242 and weighted average of 18.7%. Similarly, the statistical analysis conducted on geographies consisting of 195,708,198 people shows a mild positive correlation between the proportion of Immigrants from Hungary and percentage of population with cognitive disability in the United States with a correlation coefficient (R) of 0.353 and weighted average of 16.7%, a difference of 12.1%.
Cognitive Disability Correlation Summary
| Measurement | Indonesian | Immigrants from Hungary |
| Minimum | 6.6% | 5.2% |
| Maximum | 27.5% | 58.8% |
| Range | 20.9% | 53.6% |
| Mean | 17.7% | 18.1% |
| Median | 18.1% | 14.2% |
| Interquartile 25% (IQ1) | 16.0% | 11.8% |
| Interquartile 75% (IQ3) | 19.7% | 16.8% |
| Interquartile Range (IQR) | 3.7% | 5.0% |
| Standard Deviation (Sample) | 3.7% | 14.2% |
| Standard Deviation (Population) | 3.7% | 13.9% |
Similar Demographics by Cognitive Disability
Demographics Similar to Indonesians by Cognitive Disability
In terms of cognitive disability, the demographic groups most similar to Indonesians are Immigrants from Senegal (18.7%, a difference of 0.020%), U.S. Virgin Islander (18.7%, a difference of 0.060%), Dominican (18.7%, a difference of 0.080%), Kiowa (18.7%, a difference of 0.12%), and Pueblo (18.7%, a difference of 0.20%).
| Demographics | Rating | Rank | Cognitive Disability |
| Bangladeshis | 0.0 /100 | #318 | Tragic 18.6% |
| Comanche | 0.0 /100 | #319 | Tragic 18.6% |
| Apache | 0.0 /100 | #320 | Tragic 18.6% |
| Africans | 0.0 /100 | #321 | Tragic 18.6% |
| Immigrants | Liberia | 0.0 /100 | #322 | Tragic 18.7% |
| Pueblo | 0.0 /100 | #323 | Tragic 18.7% |
| Dominicans | 0.0 /100 | #324 | Tragic 18.7% |
| Indonesians | 0.0 /100 | #325 | Tragic 18.7% |
| Immigrants | Senegal | 0.0 /100 | #326 | Tragic 18.7% |
| U.S. Virgin Islanders | 0.0 /100 | #327 | Tragic 18.7% |
| Kiowa | 0.0 /100 | #328 | Tragic 18.7% |
| Navajo | 0.0 /100 | #329 | Tragic 18.8% |
| Immigrants | Dominican Republic | 0.0 /100 | #330 | Tragic 18.8% |
| Pima | 0.0 /100 | #331 | Tragic 18.8% |
| Immigrants | Sudan | 0.0 /100 | #332 | Tragic 18.8% |
Demographics Similar to Immigrants from Hungary by Cognitive Disability
In terms of cognitive disability, the demographic groups most similar to Immigrants from Hungary are Peruvian (16.7%, a difference of 0.0%), Immigrants from Serbia (16.7%, a difference of 0.010%), Immigrants from Bulgaria (16.7%, a difference of 0.010%), Estonian (16.7%, a difference of 0.030%), and Burmese (16.7%, a difference of 0.040%).
| Demographics | Rating | Rank | Cognitive Disability |
| Immigrants | Sweden | 99.4 /100 | #70 | Exceptional 16.7% |
| Immigrants | Belgium | 99.3 /100 | #71 | Exceptional 16.7% |
| Germans | 99.3 /100 | #72 | Exceptional 16.7% |
| Burmese | 99.3 /100 | #73 | Exceptional 16.7% |
| Slavs | 99.3 /100 | #74 | Exceptional 16.7% |
| Estonians | 99.3 /100 | #75 | Exceptional 16.7% |
| Immigrants | Serbia | 99.3 /100 | #76 | Exceptional 16.7% |
| Immigrants | Hungary | 99.3 /100 | #77 | Exceptional 16.7% |
| Peruvians | 99.3 /100 | #78 | Exceptional 16.7% |
| Immigrants | Bulgaria | 99.3 /100 | #79 | Exceptional 16.7% |
| Egyptians | 99.2 /100 | #80 | Exceptional 16.7% |
| Immigrants | Netherlands | 99.2 /100 | #81 | Exceptional 16.7% |
| Swiss | 99.2 /100 | #82 | Exceptional 16.7% |
| Serbians | 99.1 /100 | #83 | Exceptional 16.7% |
| Belgians | 99.1 /100 | #84 | Exceptional 16.7% |