Immigrants from Lebanon vs Immigrants from Morocco Cognitive Disability
COMPARE
Immigrants from Lebanon
Immigrants from Morocco
Cognitive Disability
Cognitive Disability Comparison
Immigrants from Lebanon
Immigrants from Morocco
16.8%
COGNITIVE DISABILITY
98.4/ 100
METRIC RATING
98th/ 347
METRIC RANK
17.5%
COGNITIVE DISABILITY
12.0/ 100
METRIC RATING
202nd/ 347
METRIC RANK
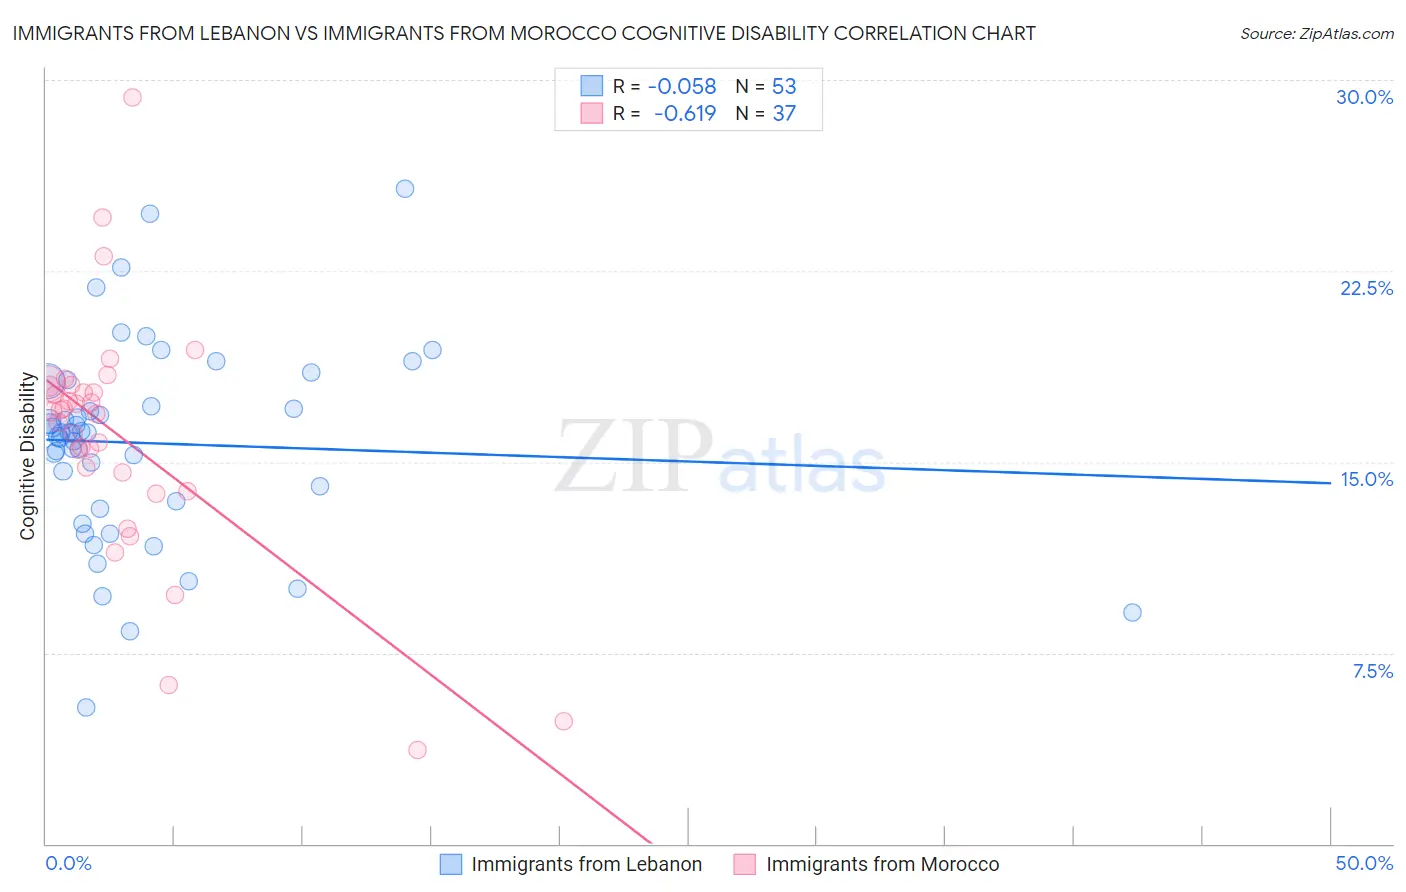
Immigrants from Lebanon vs Immigrants from Morocco Cognitive Disability Correlation Chart
The statistical analysis conducted on geographies consisting of 217,153,550 people shows a slight negative correlation between the proportion of Immigrants from Lebanon and percentage of population with cognitive disability in the United States with a correlation coefficient (R) of -0.058 and weighted average of 16.8%. Similarly, the statistical analysis conducted on geographies consisting of 178,912,345 people shows a significant negative correlation between the proportion of Immigrants from Morocco and percentage of population with cognitive disability in the United States with a correlation coefficient (R) of -0.619 and weighted average of 17.5%, a difference of 4.5%.
Cognitive Disability Correlation Summary
| Measurement | Immigrants from Lebanon | Immigrants from Morocco |
| Minimum | 5.4% | 3.7% |
| Maximum | 25.7% | 29.3% |
| Range | 20.3% | 25.6% |
| Mean | 15.7% | 16.0% |
| Median | 16.1% | 17.0% |
| Interquartile 25% (IQ1) | 13.3% | 14.2% |
| Interquartile 75% (IQ3) | 17.7% | 18.0% |
| Interquartile Range (IQR) | 4.4% | 3.8% |
| Standard Deviation (Sample) | 3.9% | 4.8% |
| Standard Deviation (Population) | 3.9% | 4.8% |
Similar Demographics by Cognitive Disability
Demographics Similar to Immigrants from Lebanon by Cognitive Disability
In terms of cognitive disability, the demographic groups most similar to Immigrants from Lebanon are Dutch (16.8%, a difference of 0.020%), Finnish (16.8%, a difference of 0.040%), English (16.8%, a difference of 0.060%), Jordanian (16.8%, a difference of 0.090%), and Asian (16.7%, a difference of 0.12%).
| Demographics | Rating | Rank | Cognitive Disability |
| Danes | 98.8 /100 | #91 | Exceptional 16.7% |
| Immigrants | South America | 98.8 /100 | #92 | Exceptional 16.7% |
| Immigrants | Southern Europe | 98.7 /100 | #93 | Exceptional 16.7% |
| Asians | 98.7 /100 | #94 | Exceptional 16.7% |
| English | 98.6 /100 | #95 | Exceptional 16.8% |
| Finns | 98.5 /100 | #96 | Exceptional 16.8% |
| Dutch | 98.5 /100 | #97 | Exceptional 16.8% |
| Immigrants | Lebanon | 98.4 /100 | #98 | Exceptional 16.8% |
| Jordanians | 98.2 /100 | #99 | Exceptional 16.8% |
| Immigrants | Russia | 98.2 /100 | #100 | Exceptional 16.8% |
| Immigrants | Asia | 98.1 /100 | #101 | Exceptional 16.8% |
| Irish | 98.1 /100 | #102 | Exceptional 16.8% |
| Paraguayans | 98.0 /100 | #103 | Exceptional 16.8% |
| Palestinians | 98.0 /100 | #104 | Exceptional 16.8% |
| Immigrants | Eastern Asia | 97.9 /100 | #105 | Exceptional 16.8% |
Demographics Similar to Immigrants from Morocco by Cognitive Disability
In terms of cognitive disability, the demographic groups most similar to Immigrants from Morocco are South American Indian (17.5%, a difference of 0.060%), Immigrants from Caribbean (17.5%, a difference of 0.070%), Immigrants from Zimbabwe (17.5%, a difference of 0.070%), Puget Sound Salish (17.5%, a difference of 0.080%), and Alaska Native (17.5%, a difference of 0.12%).
| Demographics | Rating | Rank | Cognitive Disability |
| New Zealanders | 21.1 /100 | #195 | Fair 17.4% |
| Guyanese | 17.5 /100 | #196 | Poor 17.5% |
| Immigrants | Afghanistan | 16.7 /100 | #197 | Poor 17.5% |
| Immigrants | Panama | 14.8 /100 | #198 | Poor 17.5% |
| Immigrants | Singapore | 14.3 /100 | #199 | Poor 17.5% |
| Haitians | 14.1 /100 | #200 | Poor 17.5% |
| South American Indians | 13.0 /100 | #201 | Poor 17.5% |
| Immigrants | Morocco | 12.0 /100 | #202 | Poor 17.5% |
| Immigrants | Caribbean | 11.0 /100 | #203 | Poor 17.5% |
| Immigrants | Zimbabwe | 11.0 /100 | #204 | Poor 17.5% |
| Puget Sound Salish | 10.9 /100 | #205 | Poor 17.5% |
| Alaska Natives | 10.4 /100 | #206 | Poor 17.5% |
| Immigrants | Latin America | 9.7 /100 | #207 | Tragic 17.6% |
| Immigrants | Cameroon | 9.3 /100 | #208 | Tragic 17.6% |
| Immigrants | Trinidad and Tobago | 8.7 /100 | #209 | Tragic 17.6% |