Ute vs Immigrants from Morocco Cognitive Disability
COMPARE
Ute
Immigrants from Morocco
Cognitive Disability
Cognitive Disability Comparison
Ute
Immigrants from Morocco
17.3%
COGNITIVE DISABILITY
49.1/ 100
METRIC RATING
177th/ 347
METRIC RANK
17.5%
COGNITIVE DISABILITY
12.0/ 100
METRIC RATING
202nd/ 347
METRIC RANK
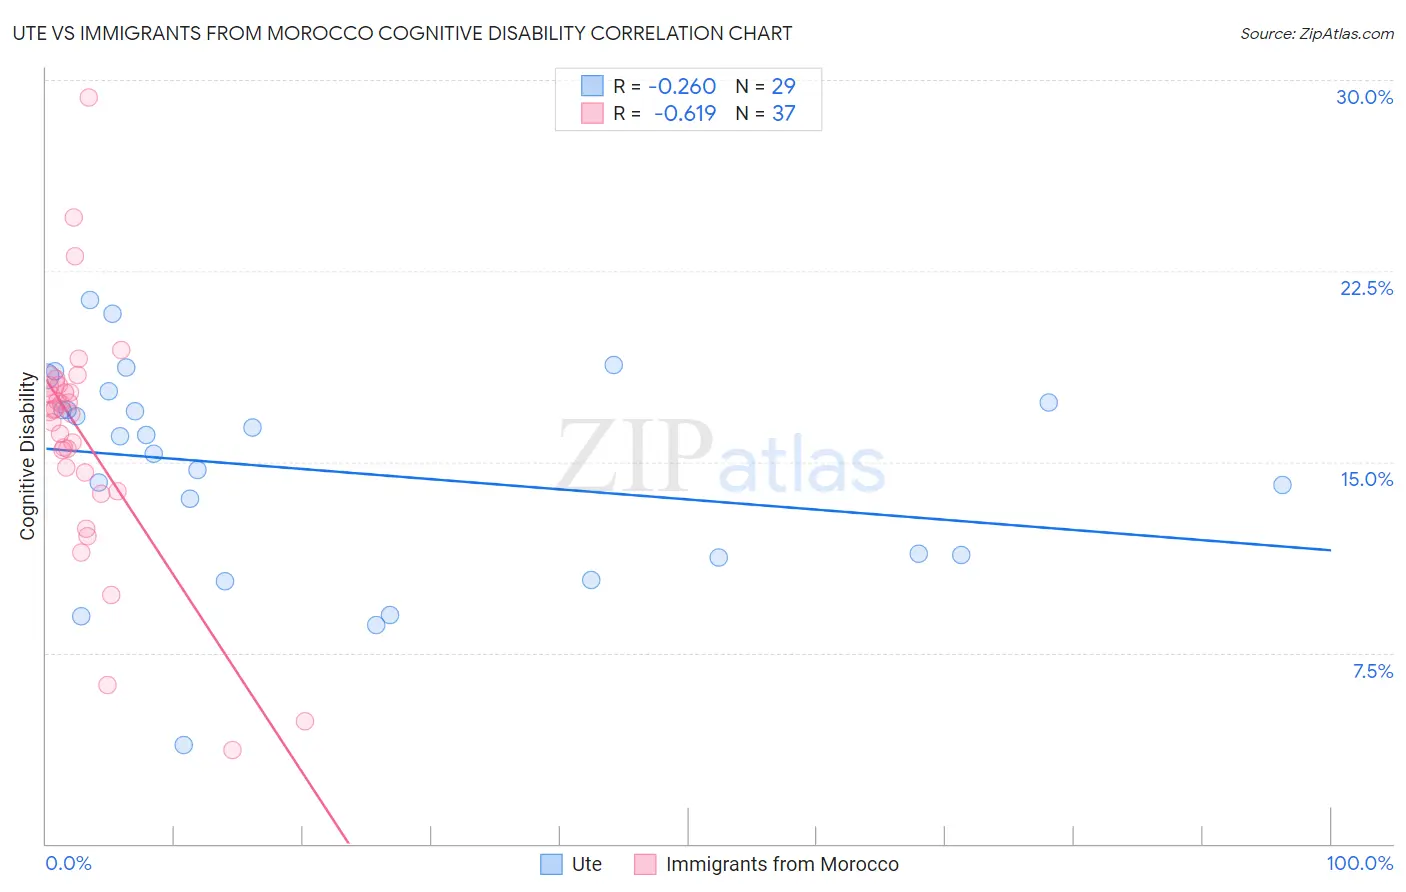
Ute vs Immigrants from Morocco Cognitive Disability Correlation Chart
The statistical analysis conducted on geographies consisting of 55,658,356 people shows a weak negative correlation between the proportion of Ute and percentage of population with cognitive disability in the United States with a correlation coefficient (R) of -0.260 and weighted average of 17.3%. Similarly, the statistical analysis conducted on geographies consisting of 178,912,345 people shows a significant negative correlation between the proportion of Immigrants from Morocco and percentage of population with cognitive disability in the United States with a correlation coefficient (R) of -0.619 and weighted average of 17.5%, a difference of 1.4%.
Cognitive Disability Correlation Summary
| Measurement | Ute | Immigrants from Morocco |
| Minimum | 3.9% | 3.7% |
| Maximum | 21.4% | 29.3% |
| Range | 17.5% | 25.6% |
| Mean | 14.6% | 16.0% |
| Median | 16.0% | 17.0% |
| Interquartile 25% (IQ1) | 11.3% | 14.2% |
| Interquartile 75% (IQ3) | 17.6% | 18.0% |
| Interquartile Range (IQR) | 6.3% | 3.8% |
| Standard Deviation (Sample) | 4.1% | 4.8% |
| Standard Deviation (Population) | 4.1% | 4.8% |
Similar Demographics by Cognitive Disability
Demographics Similar to Ute by Cognitive Disability
In terms of cognitive disability, the demographic groups most similar to Ute are Shoshone (17.3%, a difference of 0.0%), Spanish (17.3%, a difference of 0.0%), Sioux (17.3%, a difference of 0.010%), Tsimshian (17.3%, a difference of 0.020%), and Immigrants from Northern Africa (17.3%, a difference of 0.030%).
| Demographics | Rating | Rank | Cognitive Disability |
| Ecuadorians | 59.6 /100 | #170 | Average 17.2% |
| Tlingit-Haida | 59.4 /100 | #171 | Average 17.2% |
| Immigrants | Turkey | 56.7 /100 | #172 | Average 17.2% |
| Immigrants | Northern Africa | 50.2 /100 | #173 | Average 17.3% |
| Laotians | 50.0 /100 | #174 | Average 17.3% |
| Tsimshian | 49.8 /100 | #175 | Average 17.3% |
| Shoshone | 49.2 /100 | #176 | Average 17.3% |
| Ute | 49.1 /100 | #177 | Average 17.3% |
| Spanish | 48.9 /100 | #178 | Average 17.3% |
| Sioux | 48.6 /100 | #179 | Average 17.3% |
| Pakistanis | 43.9 /100 | #180 | Average 17.3% |
| Immigrants | Guyana | 42.9 /100 | #181 | Average 17.3% |
| Arabs | 42.8 /100 | #182 | Average 17.3% |
| Spaniards | 40.3 /100 | #183 | Average 17.3% |
| Crow | 39.1 /100 | #184 | Fair 17.3% |
Demographics Similar to Immigrants from Morocco by Cognitive Disability
In terms of cognitive disability, the demographic groups most similar to Immigrants from Morocco are South American Indian (17.5%, a difference of 0.060%), Immigrants from Caribbean (17.5%, a difference of 0.070%), Immigrants from Zimbabwe (17.5%, a difference of 0.070%), Puget Sound Salish (17.5%, a difference of 0.080%), and Alaska Native (17.5%, a difference of 0.12%).
| Demographics | Rating | Rank | Cognitive Disability |
| New Zealanders | 21.1 /100 | #195 | Fair 17.4% |
| Guyanese | 17.5 /100 | #196 | Poor 17.5% |
| Immigrants | Afghanistan | 16.7 /100 | #197 | Poor 17.5% |
| Immigrants | Panama | 14.8 /100 | #198 | Poor 17.5% |
| Immigrants | Singapore | 14.3 /100 | #199 | Poor 17.5% |
| Haitians | 14.1 /100 | #200 | Poor 17.5% |
| South American Indians | 13.0 /100 | #201 | Poor 17.5% |
| Immigrants | Morocco | 12.0 /100 | #202 | Poor 17.5% |
| Immigrants | Caribbean | 11.0 /100 | #203 | Poor 17.5% |
| Immigrants | Zimbabwe | 11.0 /100 | #204 | Poor 17.5% |
| Puget Sound Salish | 10.9 /100 | #205 | Poor 17.5% |
| Alaska Natives | 10.4 /100 | #206 | Poor 17.5% |
| Immigrants | Latin America | 9.7 /100 | #207 | Tragic 17.6% |
| Immigrants | Cameroon | 9.3 /100 | #208 | Tragic 17.6% |
| Immigrants | Trinidad and Tobago | 8.7 /100 | #209 | Tragic 17.6% |