Indonesian vs Cree Householder Income Under 25 years
COMPARE
Indonesian
Cree
Householder Income Under 25 years
Householder Income Under 25 years Comparison
Indonesians
Cree
$45,566
HOUSEHOLDER INCOME UNDER 25 YEARS
0.0/ 100
METRIC RATING
330th/ 347
METRIC RANK
$48,514
HOUSEHOLDER INCOME UNDER 25 YEARS
0.0/ 100
METRIC RATING
297th/ 347
METRIC RANK
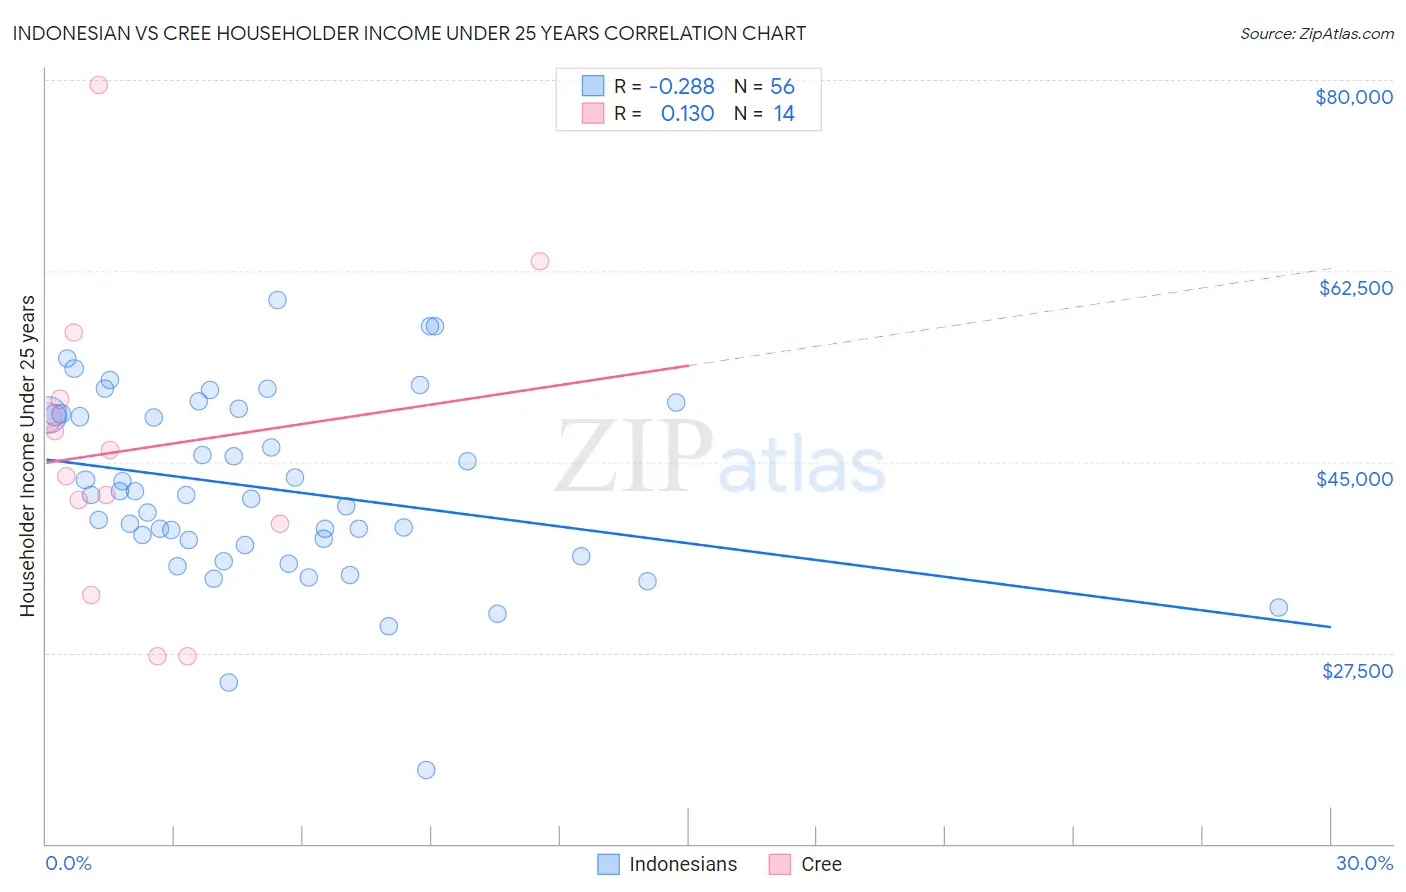
Indonesian vs Cree Householder Income Under 25 years Correlation Chart
The statistical analysis conducted on geographies consisting of 151,007,148 people shows a weak negative correlation between the proportion of Indonesians and household income with householder under the age of 25 in the United States with a correlation coefficient (R) of -0.288 and weighted average of $45,566. Similarly, the statistical analysis conducted on geographies consisting of 72,438,139 people shows a poor positive correlation between the proportion of Cree and household income with householder under the age of 25 in the United States with a correlation coefficient (R) of 0.130 and weighted average of $48,514, a difference of 6.5%.
Householder Income Under 25 years Correlation Summary
| Measurement | Indonesian | Cree |
| Minimum | $16,806 | $27,188 |
| Maximum | $59,867 | $79,562 |
| Range | $43,061 | $52,374 |
| Mean | $42,559 | $46,221 |
| Median | $41,985 | $44,879 |
| Interquartile 25% (IQ1) | $37,574 | $39,375 |
| Interquartile 75% (IQ3) | $49,366 | $50,729 |
| Interquartile Range (IQR) | $11,792 | $11,354 |
| Standard Deviation (Sample) | $8,431 | $14,003 |
| Standard Deviation (Population) | $8,355 | $13,494 |
Similar Demographics by Householder Income Under 25 years
Demographics Similar to Indonesians by Householder Income Under 25 years
In terms of householder income under 25 years, the demographic groups most similar to Indonesians are Immigrants from Zaire ($45,529, a difference of 0.080%), Seminole ($45,649, a difference of 0.18%), German Russian ($45,673, a difference of 0.23%), Choctaw ($45,450, a difference of 0.25%), and Bahamian ($45,743, a difference of 0.39%).
| Demographics | Rating | Rank | Householder Income Under 25 years |
| Immigrants | Saudi Arabia | 0.0 /100 | #323 | Tragic $46,187 |
| Dutch West Indians | 0.0 /100 | #324 | Tragic $45,816 |
| Immigrants | Bahamas | 0.0 /100 | #325 | Tragic $45,793 |
| Osage | 0.0 /100 | #326 | Tragic $45,764 |
| Bahamians | 0.0 /100 | #327 | Tragic $45,743 |
| German Russians | 0.0 /100 | #328 | Tragic $45,673 |
| Seminole | 0.0 /100 | #329 | Tragic $45,649 |
| Indonesians | 0.0 /100 | #330 | Tragic $45,566 |
| Immigrants | Zaire | 0.0 /100 | #331 | Tragic $45,529 |
| Choctaw | 0.0 /100 | #332 | Tragic $45,450 |
| Creek | 0.0 /100 | #333 | Tragic $45,371 |
| Cajuns | 0.0 /100 | #334 | Tragic $45,338 |
| Cheyenne | 0.0 /100 | #335 | Tragic $45,275 |
| Tohono O'odham | 0.0 /100 | #336 | Tragic $45,248 |
| Pueblo | 0.0 /100 | #337 | Tragic $45,018 |
Demographics Similar to Cree by Householder Income Under 25 years
In terms of householder income under 25 years, the demographic groups most similar to Cree are Blackfeet ($48,603, a difference of 0.18%), Central American Indian ($48,643, a difference of 0.26%), Somali ($48,657, a difference of 0.29%), Subsaharan African ($48,691, a difference of 0.36%), and Shoshone ($48,720, a difference of 0.42%).
| Demographics | Rating | Rank | Householder Income Under 25 years |
| Americans | 0.0 /100 | #290 | Tragic $48,860 |
| Immigrants | Burma/Myanmar | 0.0 /100 | #291 | Tragic $48,749 |
| Shoshone | 0.0 /100 | #292 | Tragic $48,720 |
| Sub-Saharan Africans | 0.0 /100 | #293 | Tragic $48,691 |
| Somalis | 0.0 /100 | #294 | Tragic $48,657 |
| Central American Indians | 0.0 /100 | #295 | Tragic $48,643 |
| Blackfeet | 0.0 /100 | #296 | Tragic $48,603 |
| Cree | 0.0 /100 | #297 | Tragic $48,514 |
| Yaqui | 0.0 /100 | #298 | Tragic $48,300 |
| Immigrants | Honduras | 0.0 /100 | #299 | Tragic $48,267 |
| Immigrants | Somalia | 0.0 /100 | #300 | Tragic $48,135 |
| Immigrants | Kuwait | 0.0 /100 | #301 | Tragic $48,126 |
| Immigrants | Liberia | 0.0 /100 | #302 | Tragic $47,981 |
| Immigrants | Middle Africa | 0.0 /100 | #303 | Tragic $47,916 |
| Menominee | 0.0 /100 | #304 | Tragic $47,907 |