Indonesian vs Senegalese Ambulatory Disability
COMPARE
Indonesian
Senegalese
Ambulatory Disability
Ambulatory Disability Comparison
Indonesians
Senegalese
6.3%
AMBULATORY DISABILITY
9.9/ 100
METRIC RATING
219th/ 347
METRIC RANK
6.4%
AMBULATORY DISABILITY
1.7/ 100
METRIC RATING
239th/ 347
METRIC RANK
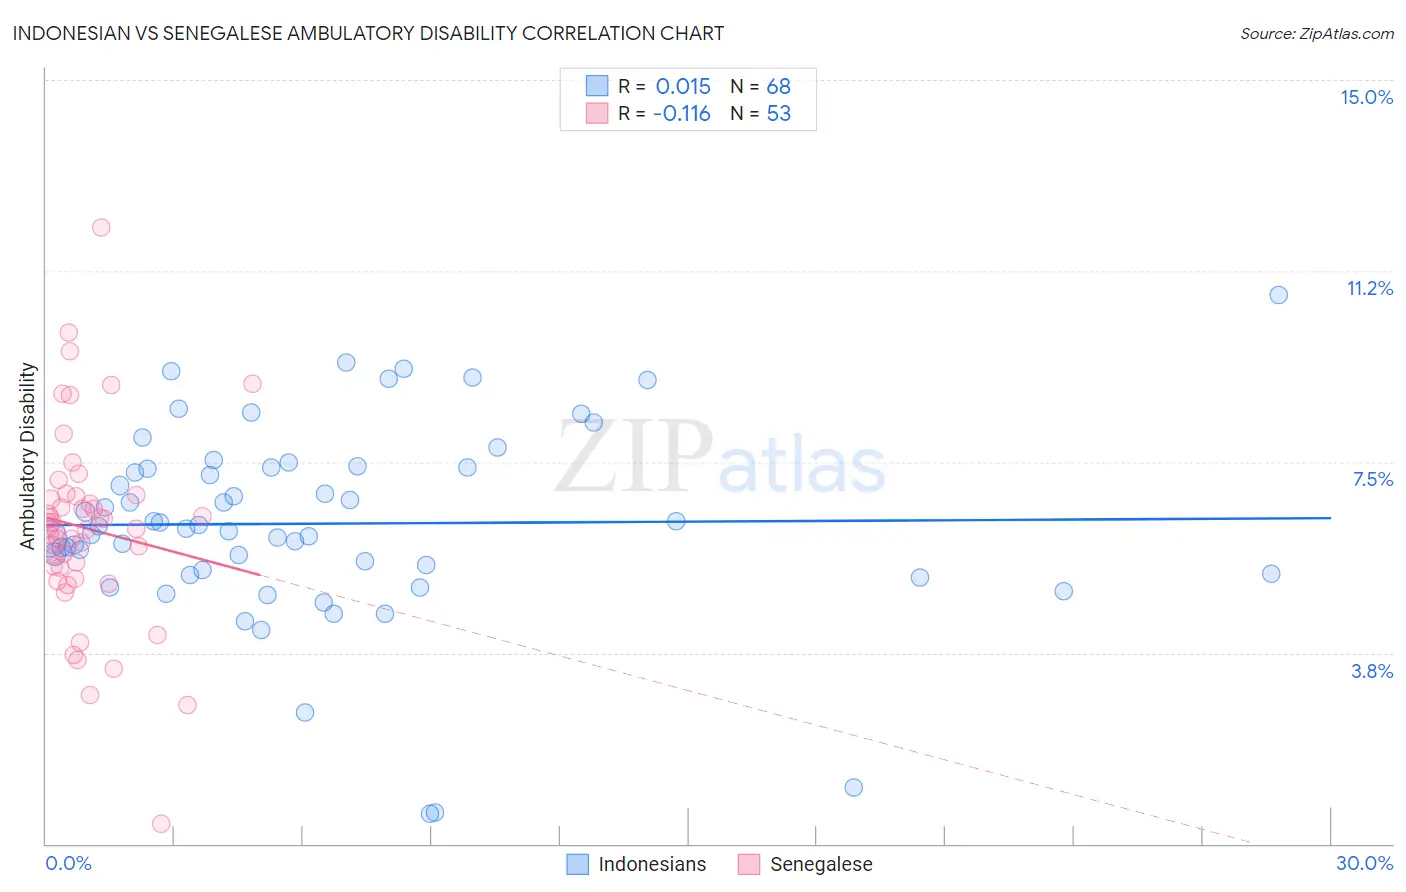
Indonesian vs Senegalese Ambulatory Disability Correlation Chart
The statistical analysis conducted on geographies consisting of 162,682,177 people shows no correlation between the proportion of Indonesians and percentage of population with ambulatory disability in the United States with a correlation coefficient (R) of 0.015 and weighted average of 6.3%. Similarly, the statistical analysis conducted on geographies consisting of 78,138,068 people shows a poor negative correlation between the proportion of Senegalese and percentage of population with ambulatory disability in the United States with a correlation coefficient (R) of -0.116 and weighted average of 6.4%, a difference of 2.4%.
Ambulatory Disability Correlation Summary
| Measurement | Indonesian | Senegalese |
| Minimum | 0.59% | 0.40% |
| Maximum | 10.8% | 12.1% |
| Range | 10.2% | 11.7% |
| Mean | 6.3% | 6.2% |
| Median | 6.2% | 6.2% |
| Interquartile 25% (IQ1) | 5.3% | 5.3% |
| Interquartile 75% (IQ3) | 7.4% | 6.8% |
| Interquartile Range (IQR) | 2.1% | 1.5% |
| Standard Deviation (Sample) | 1.9% | 1.9% |
| Standard Deviation (Population) | 1.9% | 1.9% |
Demographics Similar to Indonesians and Senegalese by Ambulatory Disability
In terms of ambulatory disability, the demographic groups most similar to Indonesians are Immigrants from Albania (6.3%, a difference of 0.040%), Hungarian (6.3%, a difference of 0.050%), German Russian (6.3%, a difference of 0.070%), Immigrants from Honduras (6.3%, a difference of 0.37%), and Liberian (6.3%, a difference of 0.46%). Similarly, the demographic groups most similar to Senegalese are Haitian (6.4%, a difference of 0.070%), Immigrants from Germany (6.4%, a difference of 0.080%), Dutch (6.4%, a difference of 0.16%), Hispanic or Latino (6.4%, a difference of 0.32%), and Immigrants from Liberia (6.4%, a difference of 0.35%).
| Demographics | Rating | Rank | Ambulatory Disability |
| Indonesians | 9.9 /100 | #219 | Tragic 6.3% |
| Immigrants | Albania | 9.6 /100 | #220 | Tragic 6.3% |
| Hungarians | 9.6 /100 | #221 | Tragic 6.3% |
| German Russians | 9.4 /100 | #222 | Tragic 6.3% |
| Immigrants | Honduras | 7.6 /100 | #223 | Tragic 6.3% |
| Liberians | 7.1 /100 | #224 | Tragic 6.3% |
| Hondurans | 6.3 /100 | #225 | Tragic 6.3% |
| Slavs | 5.1 /100 | #226 | Tragic 6.4% |
| Cubans | 4.0 /100 | #227 | Tragic 6.4% |
| Portuguese | 4.0 /100 | #228 | Tragic 6.4% |
| Czechoslovakians | 3.8 /100 | #229 | Tragic 6.4% |
| Mexicans | 3.5 /100 | #230 | Tragic 6.4% |
| Panamanians | 3.1 /100 | #231 | Tragic 6.4% |
| Assyrians/Chaldeans/Syriacs | 2.4 /100 | #232 | Tragic 6.4% |
| Sub-Saharan Africans | 2.3 /100 | #233 | Tragic 6.4% |
| Immigrants | Liberia | 2.3 /100 | #234 | Tragic 6.4% |
| Hispanics or Latinos | 2.2 /100 | #235 | Tragic 6.4% |
| Dutch | 2.0 /100 | #236 | Tragic 6.4% |
| Immigrants | Germany | 1.8 /100 | #237 | Tragic 6.4% |
| Haitians | 1.8 /100 | #238 | Tragic 6.4% |
| Senegalese | 1.7 /100 | #239 | Tragic 6.4% |