Indonesian vs Immigrants from Kuwait Disability Age Under 5
COMPARE
Indonesian
Immigrants from Kuwait
Disability Age Under 5
Disability Age Under 5 Comparison
Indonesians
Immigrants from Kuwait
1.2%
DISABILITY AGE UNDER 5
95.9/ 100
METRIC RATING
104th/ 347
METRIC RANK
1.2%
DISABILITY AGE UNDER 5
62.6/ 100
METRIC RATING
165th/ 347
METRIC RANK
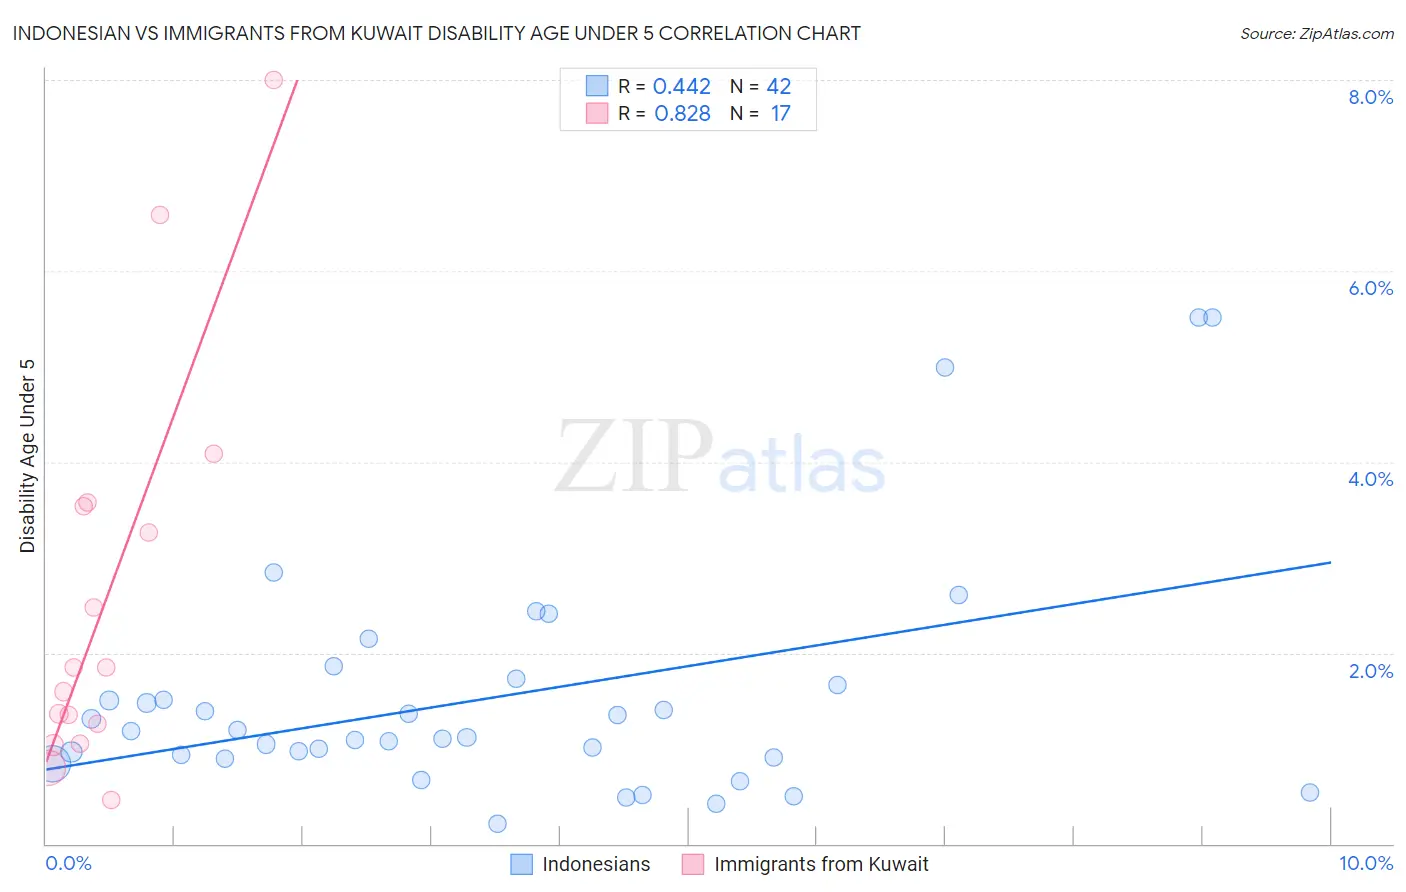
Indonesian vs Immigrants from Kuwait Disability Age Under 5 Correlation Chart
The statistical analysis conducted on geographies consisting of 116,670,957 people shows a moderate positive correlation between the proportion of Indonesians and percentage of population with a disability under the age of 5 in the United States with a correlation coefficient (R) of 0.442 and weighted average of 1.2%. Similarly, the statistical analysis conducted on geographies consisting of 100,801,257 people shows a very strong positive correlation between the proportion of Immigrants from Kuwait and percentage of population with a disability under the age of 5 in the United States with a correlation coefficient (R) of 0.828 and weighted average of 1.2%, a difference of 6.4%.
Disability Age Under 5 Correlation Summary
| Measurement | Indonesian | Immigrants from Kuwait |
| Minimum | 0.21% | 0.45% |
| Maximum | 5.5% | 8.0% |
| Range | 5.3% | 7.5% |
| Mean | 1.5% | 2.6% |
| Median | 1.1% | 1.8% |
| Interquartile 25% (IQ1) | 0.90% | 1.1% |
| Interquartile 75% (IQ3) | 1.7% | 3.6% |
| Interquartile Range (IQR) | 0.76% | 2.4% |
| Standard Deviation (Sample) | 1.2% | 2.1% |
| Standard Deviation (Population) | 1.2% | 2.0% |
Similar Demographics by Disability Age Under 5
Demographics Similar to Indonesians by Disability Age Under 5
In terms of disability age under 5, the demographic groups most similar to Indonesians are Immigrants from Morocco (1.2%, a difference of 0.070%), Immigrants from Nicaragua (1.2%, a difference of 0.070%), Immigrants from Uganda (1.1%, a difference of 0.12%), Immigrants from South Africa (1.2%, a difference of 0.19%), and Nicaraguan (1.1%, a difference of 0.24%).
| Demographics | Rating | Rank | Disability Age Under 5 |
| Immigrants | Iraq | 96.5 /100 | #97 | Exceptional 1.1% |
| Immigrants | South Eastern Asia | 96.5 /100 | #98 | Exceptional 1.1% |
| Dominicans | 96.3 /100 | #99 | Exceptional 1.1% |
| Nicaraguans | 96.3 /100 | #100 | Exceptional 1.1% |
| Immigrants | Uganda | 96.1 /100 | #101 | Exceptional 1.1% |
| Immigrants | Morocco | 96.0 /100 | #102 | Exceptional 1.2% |
| Immigrants | Nicaragua | 96.0 /100 | #103 | Exceptional 1.2% |
| Indonesians | 95.9 /100 | #104 | Exceptional 1.2% |
| Immigrants | South Africa | 95.6 /100 | #105 | Exceptional 1.2% |
| Cambodians | 95.4 /100 | #106 | Exceptional 1.2% |
| Immigrants | West Indies | 95.3 /100 | #107 | Exceptional 1.2% |
| Iraqis | 95.1 /100 | #108 | Exceptional 1.2% |
| Immigrants | Panama | 95.0 /100 | #109 | Exceptional 1.2% |
| Immigrants | Lebanon | 95.0 /100 | #110 | Exceptional 1.2% |
| Senegalese | 94.6 /100 | #111 | Exceptional 1.2% |
Demographics Similar to Immigrants from Kuwait by Disability Age Under 5
In terms of disability age under 5, the demographic groups most similar to Immigrants from Kuwait are Laotian (1.2%, a difference of 0.020%), Immigrants from Guatemala (1.2%, a difference of 0.070%), Guatemalan (1.2%, a difference of 0.10%), Immigrants from Central America (1.2%, a difference of 0.11%), and Immigrants from Argentina (1.2%, a difference of 0.22%).
| Demographics | Rating | Rank | Disability Age Under 5 |
| Arabs | 66.4 /100 | #158 | Good 1.2% |
| Colombians | 65.8 /100 | #159 | Good 1.2% |
| Immigrants | Latin America | 65.8 /100 | #160 | Good 1.2% |
| Immigrants | Africa | 65.1 /100 | #161 | Good 1.2% |
| Guatemalans | 63.6 /100 | #162 | Good 1.2% |
| Immigrants | Guatemala | 63.2 /100 | #163 | Good 1.2% |
| Laotians | 62.8 /100 | #164 | Good 1.2% |
| Immigrants | Kuwait | 62.6 /100 | #165 | Good 1.2% |
| Immigrants | Central America | 61.4 /100 | #166 | Good 1.2% |
| Immigrants | Argentina | 60.2 /100 | #167 | Good 1.2% |
| Sierra Leoneans | 59.1 /100 | #168 | Average 1.2% |
| Immigrants | Uruguay | 59.0 /100 | #169 | Average 1.2% |
| Immigrants | Jamaica | 58.8 /100 | #170 | Average 1.2% |
| Guamanians/Chamorros | 57.8 /100 | #171 | Average 1.2% |
| Crow | 51.0 /100 | #172 | Average 1.2% |