Indonesian vs Immigrants from Western Europe Disability Age Under 5
COMPARE
Indonesian
Immigrants from Western Europe
Disability Age Under 5
Disability Age Under 5 Comparison
Indonesians
Immigrants from Western Europe
1.2%
DISABILITY AGE UNDER 5
95.9/ 100
METRIC RATING
104th/ 347
METRIC RANK
1.4%
DISABILITY AGE UNDER 5
0.5/ 100
METRIC RATING
256th/ 347
METRIC RANK
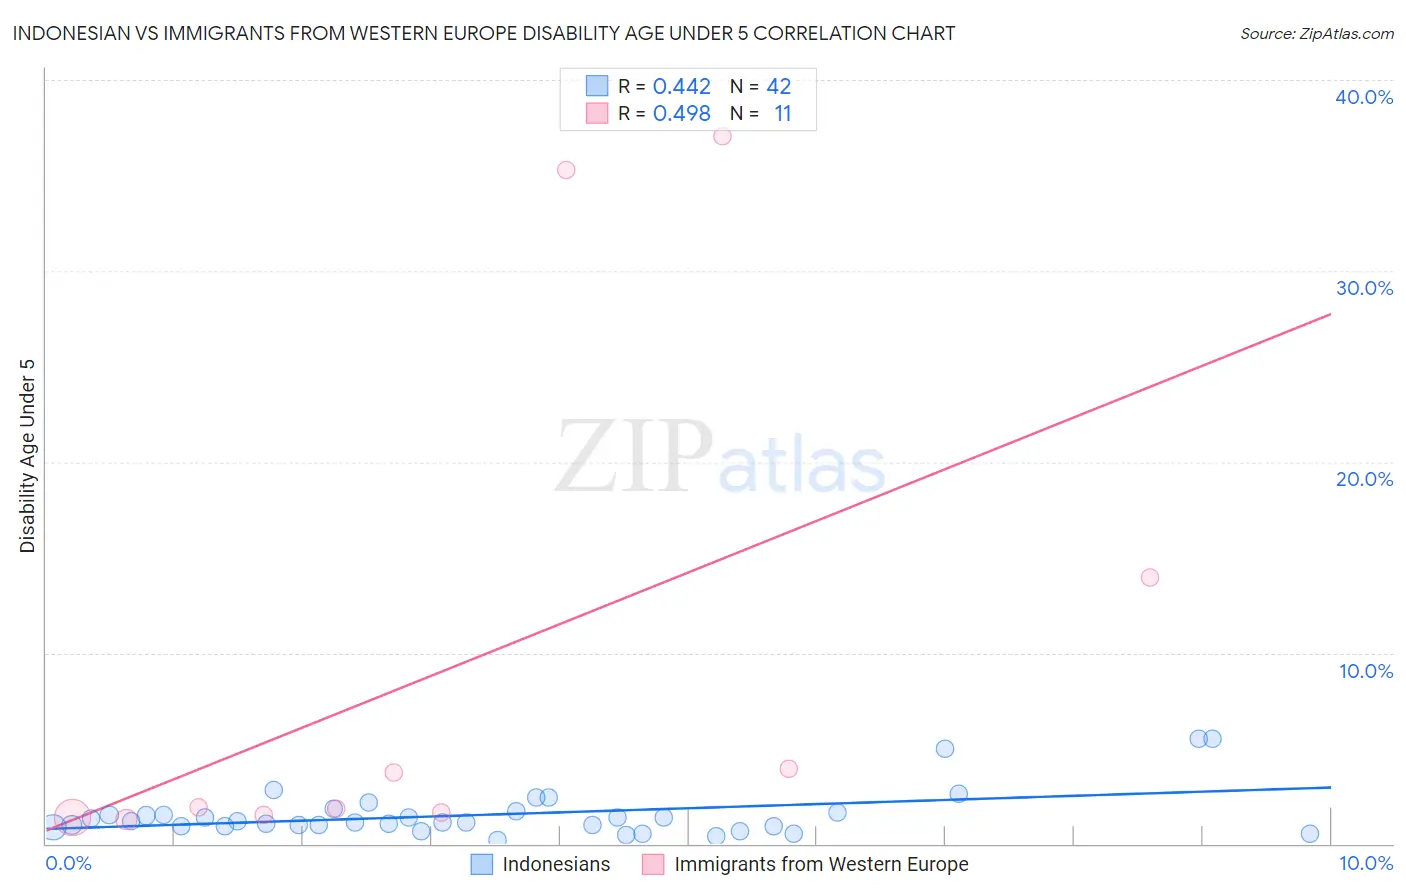
Indonesian vs Immigrants from Western Europe Disability Age Under 5 Correlation Chart
The statistical analysis conducted on geographies consisting of 116,670,957 people shows a moderate positive correlation between the proportion of Indonesians and percentage of population with a disability under the age of 5 in the United States with a correlation coefficient (R) of 0.442 and weighted average of 1.2%. Similarly, the statistical analysis conducted on geographies consisting of 244,253,357 people shows a moderate positive correlation between the proportion of Immigrants from Western Europe and percentage of population with a disability under the age of 5 in the United States with a correlation coefficient (R) of 0.498 and weighted average of 1.4%, a difference of 20.5%.
Disability Age Under 5 Correlation Summary
| Measurement | Indonesian | Immigrants from Western Europe |
| Minimum | 0.21% | 1.3% |
| Maximum | 5.5% | 37.0% |
| Range | 5.3% | 35.8% |
| Mean | 1.5% | 9.4% |
| Median | 1.1% | 1.9% |
| Interquartile 25% (IQ1) | 0.90% | 1.5% |
| Interquartile 75% (IQ3) | 1.7% | 14.0% |
| Interquartile Range (IQR) | 0.76% | 12.4% |
| Standard Deviation (Sample) | 1.2% | 13.7% |
| Standard Deviation (Population) | 1.2% | 13.1% |
Similar Demographics by Disability Age Under 5
Demographics Similar to Indonesians by Disability Age Under 5
In terms of disability age under 5, the demographic groups most similar to Indonesians are Immigrants from Morocco (1.2%, a difference of 0.070%), Immigrants from Nicaragua (1.2%, a difference of 0.070%), Immigrants from Uganda (1.1%, a difference of 0.12%), Immigrants from South Africa (1.2%, a difference of 0.19%), and Nicaraguan (1.1%, a difference of 0.24%).
| Demographics | Rating | Rank | Disability Age Under 5 |
| Immigrants | Iraq | 96.5 /100 | #97 | Exceptional 1.1% |
| Immigrants | South Eastern Asia | 96.5 /100 | #98 | Exceptional 1.1% |
| Dominicans | 96.3 /100 | #99 | Exceptional 1.1% |
| Nicaraguans | 96.3 /100 | #100 | Exceptional 1.1% |
| Immigrants | Uganda | 96.1 /100 | #101 | Exceptional 1.1% |
| Immigrants | Morocco | 96.0 /100 | #102 | Exceptional 1.2% |
| Immigrants | Nicaragua | 96.0 /100 | #103 | Exceptional 1.2% |
| Indonesians | 95.9 /100 | #104 | Exceptional 1.2% |
| Immigrants | South Africa | 95.6 /100 | #105 | Exceptional 1.2% |
| Cambodians | 95.4 /100 | #106 | Exceptional 1.2% |
| Immigrants | West Indies | 95.3 /100 | #107 | Exceptional 1.2% |
| Iraqis | 95.1 /100 | #108 | Exceptional 1.2% |
| Immigrants | Panama | 95.0 /100 | #109 | Exceptional 1.2% |
| Immigrants | Lebanon | 95.0 /100 | #110 | Exceptional 1.2% |
| Senegalese | 94.6 /100 | #111 | Exceptional 1.2% |
Demographics Similar to Immigrants from Western Europe by Disability Age Under 5
In terms of disability age under 5, the demographic groups most similar to Immigrants from Western Europe are Immigrants from Liberia (1.4%, a difference of 0.42%), Immigrants from Brazil (1.4%, a difference of 0.48%), Australian (1.4%, a difference of 0.56%), Slovene (1.4%, a difference of 0.89%), and Costa Rican (1.4%, a difference of 1.1%).
| Demographics | Rating | Rank | Disability Age Under 5 |
| Bermudans | 1.0 /100 | #249 | Tragic 1.4% |
| Africans | 1.0 /100 | #250 | Tragic 1.4% |
| Immigrants | Hungary | 1.0 /100 | #251 | Tragic 1.4% |
| Immigrants | Scotland | 0.9 /100 | #252 | Tragic 1.4% |
| Australians | 0.7 /100 | #253 | Tragic 1.4% |
| Immigrants | Brazil | 0.7 /100 | #254 | Tragic 1.4% |
| Immigrants | Liberia | 0.6 /100 | #255 | Tragic 1.4% |
| Immigrants | Western Europe | 0.5 /100 | #256 | Tragic 1.4% |
| Slovenes | 0.3 /100 | #257 | Tragic 1.4% |
| Costa Ricans | 0.3 /100 | #258 | Tragic 1.4% |
| Immigrants | Southern Europe | 0.3 /100 | #259 | Tragic 1.4% |
| Slavs | 0.3 /100 | #260 | Tragic 1.4% |
| Immigrants | Netherlands | 0.2 /100 | #261 | Tragic 1.4% |
| Immigrants | Dominica | 0.2 /100 | #262 | Tragic 1.4% |
| Spanish | 0.2 /100 | #263 | Tragic 1.4% |