Indian (Asian) vs Immigrants from Cameroon Vision Disability
COMPARE
Indian (Asian)
Immigrants from Cameroon
Vision Disability
Vision Disability Comparison
Indians (Asian)
Immigrants from Cameroon
1.8%
VISION DISABILITY
100.0/ 100
METRIC RATING
16th/ 347
METRIC RANK
2.1%
VISION DISABILITY
88.8/ 100
METRIC RATING
129th/ 347
METRIC RANK
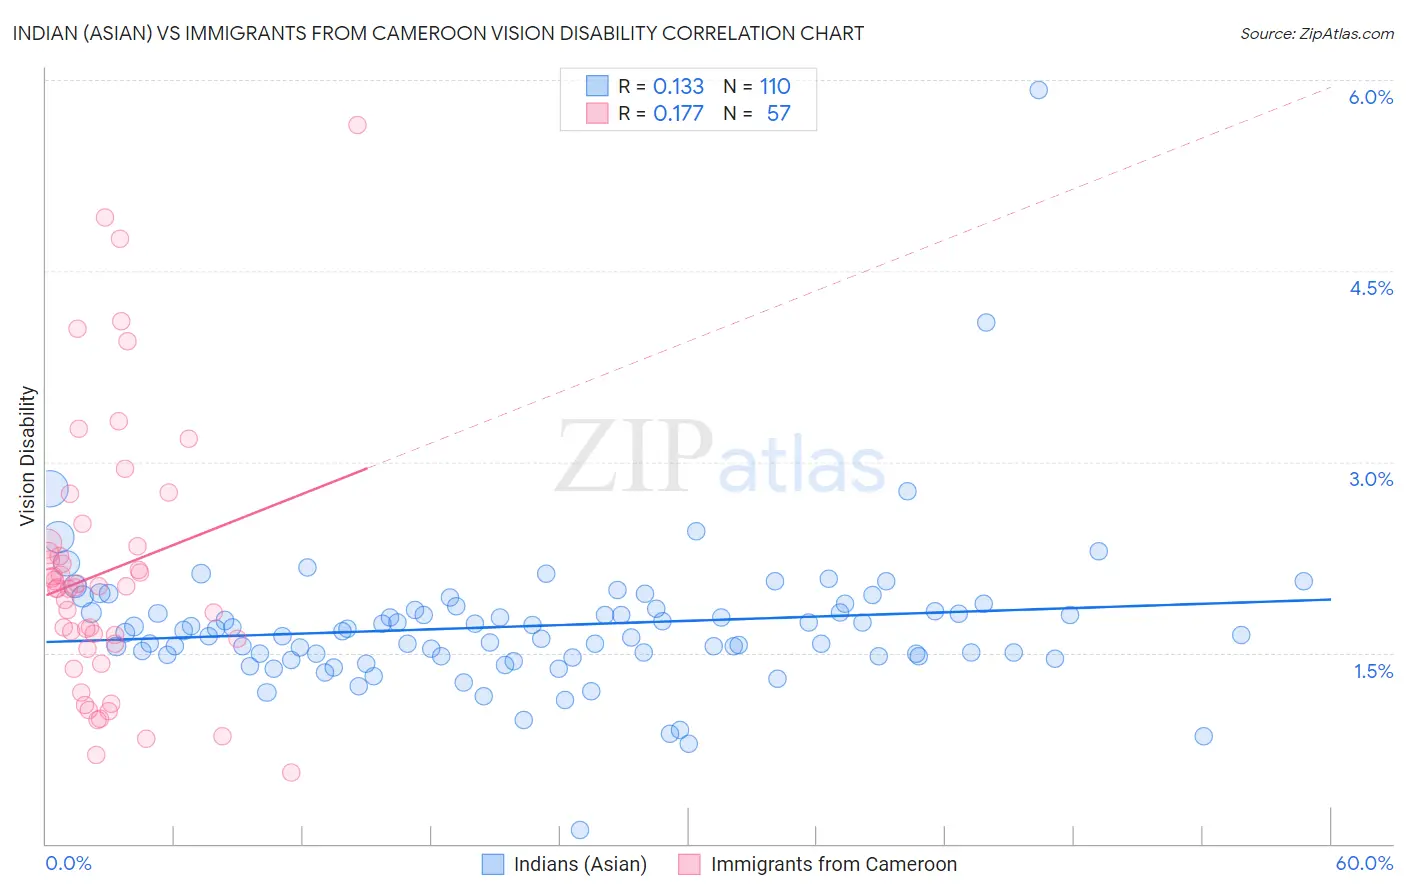
Indian (Asian) vs Immigrants from Cameroon Vision Disability Correlation Chart
The statistical analysis conducted on geographies consisting of 494,549,615 people shows a poor positive correlation between the proportion of Indians (Asian) and percentage of population with vision disability in the United States with a correlation coefficient (R) of 0.133 and weighted average of 1.8%. Similarly, the statistical analysis conducted on geographies consisting of 130,705,154 people shows a poor positive correlation between the proportion of Immigrants from Cameroon and percentage of population with vision disability in the United States with a correlation coefficient (R) of 0.177 and weighted average of 2.1%, a difference of 13.3%.
Vision Disability Correlation Summary
| Measurement | Indian (Asian) | Immigrants from Cameroon |
| Minimum | 0.11% | 0.56% |
| Maximum | 5.9% | 5.6% |
| Range | 5.8% | 5.1% |
| Mean | 1.7% | 2.1% |
| Median | 1.7% | 2.0% |
| Interquartile 25% (IQ1) | 1.5% | 1.6% |
| Interquartile 75% (IQ3) | 1.8% | 2.3% |
| Interquartile Range (IQR) | 0.36% | 0.79% |
| Standard Deviation (Sample) | 0.60% | 1.1% |
| Standard Deviation (Population) | 0.60% | 1.1% |
Similar Demographics by Vision Disability
Demographics Similar to Indians (Asian) by Vision Disability
In terms of vision disability, the demographic groups most similar to Indians (Asian) are Burmese (1.8%, a difference of 0.010%), Bolivian (1.9%, a difference of 0.42%), Immigrants from Bolivia (1.8%, a difference of 0.44%), Immigrants from China (1.8%, a difference of 0.87%), and Immigrants from Eastern Asia (1.8%, a difference of 1.0%).
| Demographics | Rating | Rank | Vision Disability |
| Immigrants | Singapore | 100.0 /100 | #9 | Exceptional 1.8% |
| Immigrants | Hong Kong | 100.0 /100 | #10 | Exceptional 1.8% |
| Immigrants | Israel | 100.0 /100 | #11 | Exceptional 1.8% |
| Immigrants | Korea | 100.0 /100 | #12 | Exceptional 1.8% |
| Immigrants | Eastern Asia | 100.0 /100 | #13 | Exceptional 1.8% |
| Immigrants | China | 100.0 /100 | #14 | Exceptional 1.8% |
| Immigrants | Bolivia | 100.0 /100 | #15 | Exceptional 1.8% |
| Indians (Asian) | 100.0 /100 | #16 | Exceptional 1.8% |
| Burmese | 100.0 /100 | #17 | Exceptional 1.8% |
| Bolivians | 100.0 /100 | #18 | Exceptional 1.9% |
| Immigrants | Sri Lanka | 100.0 /100 | #19 | Exceptional 1.9% |
| Asians | 100.0 /100 | #20 | Exceptional 1.9% |
| Turks | 100.0 /100 | #21 | Exceptional 1.9% |
| Immigrants | Pakistan | 100.0 /100 | #22 | Exceptional 1.9% |
| Immigrants | Asia | 99.9 /100 | #23 | Exceptional 1.9% |
Demographics Similar to Immigrants from Cameroon by Vision Disability
In terms of vision disability, the demographic groups most similar to Immigrants from Cameroon are Immigrants from Kenya (2.1%, a difference of 0.010%), Immigrants from Hungary (2.1%, a difference of 0.020%), Immigrants from Chile (2.1%, a difference of 0.030%), Sudanese (2.1%, a difference of 0.070%), and New Zealander (2.1%, a difference of 0.10%).
| Demographics | Rating | Rank | Vision Disability |
| Immigrants | Ukraine | 90.4 /100 | #122 | Exceptional 2.1% |
| Immigrants | Albania | 90.4 /100 | #123 | Exceptional 2.1% |
| Immigrants | Spain | 89.8 /100 | #124 | Excellent 2.1% |
| Immigrants | Venezuela | 89.8 /100 | #125 | Excellent 2.1% |
| Immigrants | Peru | 89.5 /100 | #126 | Excellent 2.1% |
| Sudanese | 89.2 /100 | #127 | Excellent 2.1% |
| Immigrants | Chile | 89.0 /100 | #128 | Excellent 2.1% |
| Immigrants | Cameroon | 88.8 /100 | #129 | Excellent 2.1% |
| Immigrants | Kenya | 88.7 /100 | #130 | Excellent 2.1% |
| Immigrants | Hungary | 88.7 /100 | #131 | Excellent 2.1% |
| New Zealanders | 88.2 /100 | #132 | Excellent 2.1% |
| Syrians | 87.5 /100 | #133 | Excellent 2.1% |
| Venezuelans | 87.2 /100 | #134 | Excellent 2.1% |
| Vietnamese | 86.7 /100 | #135 | Excellent 2.1% |
| Czechs | 86.3 /100 | #136 | Excellent 2.1% |