Immigrants vs Immigrants from Africa Ambulatory Disability
COMPARE
Immigrants
Immigrants from Africa
Ambulatory Disability
Ambulatory Disability Comparison
Immigrants
Immigrants from Africa
6.0%
AMBULATORY DISABILITY
86.9/ 100
METRIC RATING
133rd/ 347
METRIC RANK
5.9%
AMBULATORY DISABILITY
94.7/ 100
METRIC RATING
116th/ 347
METRIC RANK
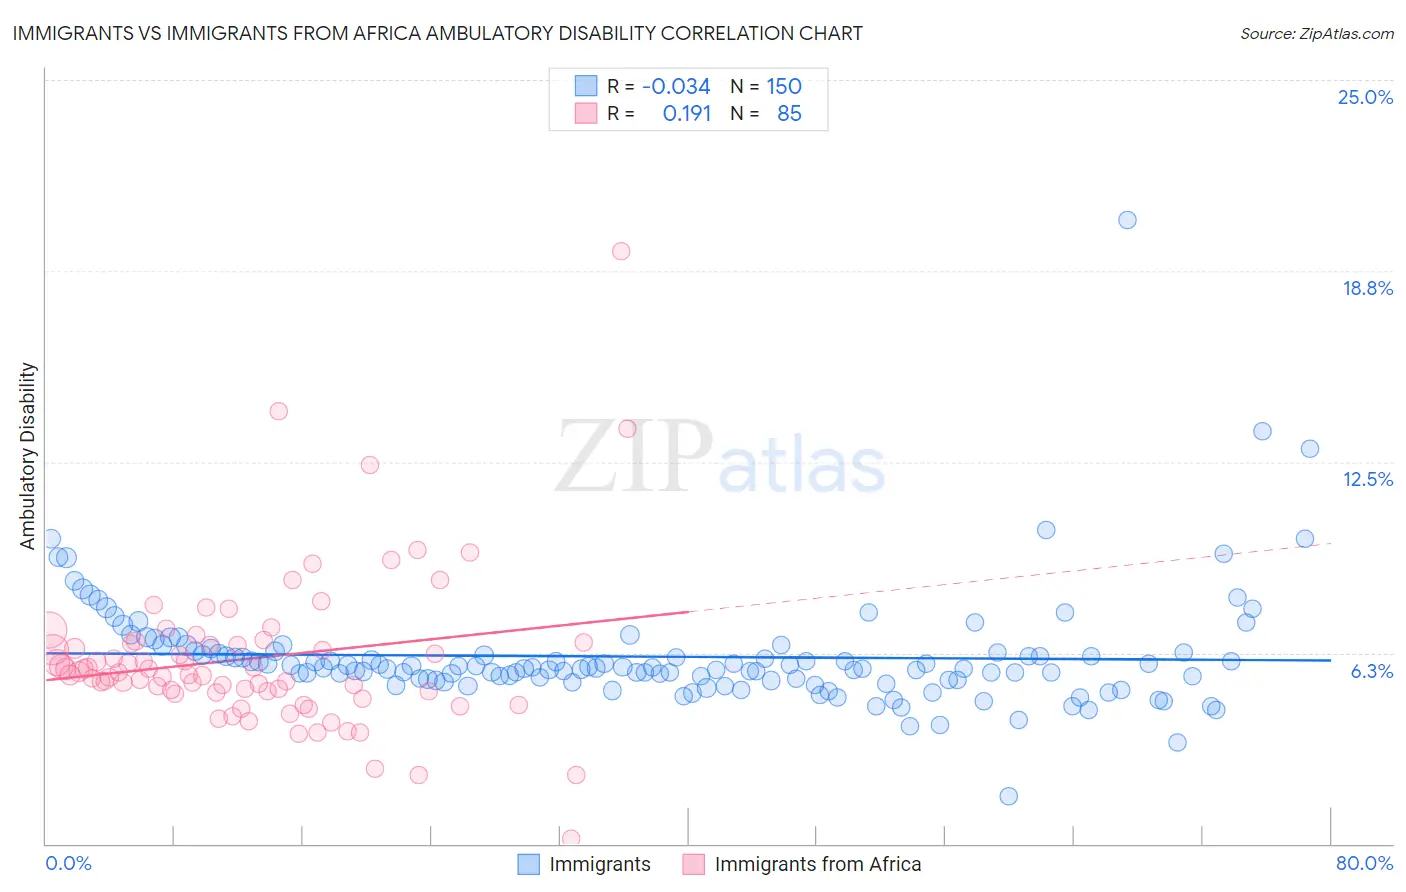
Immigrants vs Immigrants from Africa Ambulatory Disability Correlation Chart
The statistical analysis conducted on geographies consisting of 577,108,062 people shows no correlation between the proportion of Immigrants and percentage of population with ambulatory disability in the United States with a correlation coefficient (R) of -0.034 and weighted average of 6.0%. Similarly, the statistical analysis conducted on geographies consisting of 469,140,674 people shows a poor positive correlation between the proportion of Immigrants from Africa and percentage of population with ambulatory disability in the United States with a correlation coefficient (R) of 0.191 and weighted average of 5.9%, a difference of 1.4%.
Ambulatory Disability Correlation Summary
| Measurement | Immigrants | Immigrants from Africa |
| Minimum | 1.6% | 0.17% |
| Maximum | 20.4% | 19.4% |
| Range | 18.8% | 19.2% |
| Mean | 6.1% | 6.1% |
| Median | 5.8% | 5.6% |
| Interquartile 25% (IQ1) | 5.4% | 5.0% |
| Interquartile 75% (IQ3) | 6.2% | 6.6% |
| Interquartile Range (IQR) | 0.89% | 1.6% |
| Standard Deviation (Sample) | 1.9% | 2.6% |
| Standard Deviation (Population) | 1.9% | 2.6% |
Demographics Similar to Immigrants and Immigrants from Africa by Ambulatory Disability
In terms of ambulatory disability, the demographic groups most similar to Immigrants are Ute (6.0%, a difference of 0.040%), Immigrants from Europe (6.0%, a difference of 0.11%), Immigrants from Costa Rica (5.9%, a difference of 0.35%), Immigrants from Kazakhstan (5.9%, a difference of 0.38%), and Immigrants from Norway (5.9%, a difference of 0.49%). Similarly, the demographic groups most similar to Immigrants from Africa are South American Indian (5.9%, a difference of 0.010%), Immigrants from Poland (5.9%, a difference of 0.22%), Immigrants from South Eastern Asia (5.9%, a difference of 0.28%), Russian (5.9%, a difference of 0.32%), and Norwegian (5.9%, a difference of 0.39%).
| Demographics | Rating | Rank | Ambulatory Disability |
| Immigrants | Poland | 95.4 /100 | #114 | Exceptional 5.9% |
| South American Indians | 94.8 /100 | #115 | Exceptional 5.9% |
| Immigrants | Africa | 94.7 /100 | #116 | Exceptional 5.9% |
| Immigrants | South Eastern Asia | 93.6 /100 | #117 | Exceptional 5.9% |
| Russians | 93.4 /100 | #118 | Exceptional 5.9% |
| Norwegians | 93.1 /100 | #119 | Exceptional 5.9% |
| Estonians | 92.9 /100 | #120 | Exceptional 5.9% |
| Costa Ricans | 92.6 /100 | #121 | Exceptional 5.9% |
| Icelanders | 92.6 /100 | #122 | Exceptional 5.9% |
| Immigrants | Russia | 92.4 /100 | #123 | Exceptional 5.9% |
| Immigrants | Middle Africa | 92.2 /100 | #124 | Exceptional 5.9% |
| Koreans | 91.6 /100 | #125 | Exceptional 5.9% |
| Arabs | 91.5 /100 | #126 | Exceptional 5.9% |
| Immigrants | Nigeria | 90.9 /100 | #127 | Exceptional 5.9% |
| Immigrants | Western Asia | 90.7 /100 | #128 | Exceptional 5.9% |
| Immigrants | Norway | 90.5 /100 | #129 | Exceptional 5.9% |
| Immigrants | Kazakhstan | 89.7 /100 | #130 | Excellent 5.9% |
| Immigrants | Costa Rica | 89.5 /100 | #131 | Excellent 5.9% |
| Immigrants | Europe | 87.8 /100 | #132 | Excellent 6.0% |
| Immigrants | Immigrants | 86.9 /100 | #133 | Excellent 6.0% |
| Ute | 86.6 /100 | #134 | Excellent 6.0% |