Immigrants vs Immigrants from Africa Median Family Income
COMPARE
Immigrants
Immigrants from Africa
Median Family Income
Median Family Income Comparison
Immigrants
Immigrants from Africa
$100,962
MEDIAN FAMILY INCOME
29.4/ 100
METRIC RATING
190th/ 347
METRIC RANK
$100,256
MEDIAN FAMILY INCOME
22.5/ 100
METRIC RATING
198th/ 347
METRIC RANK
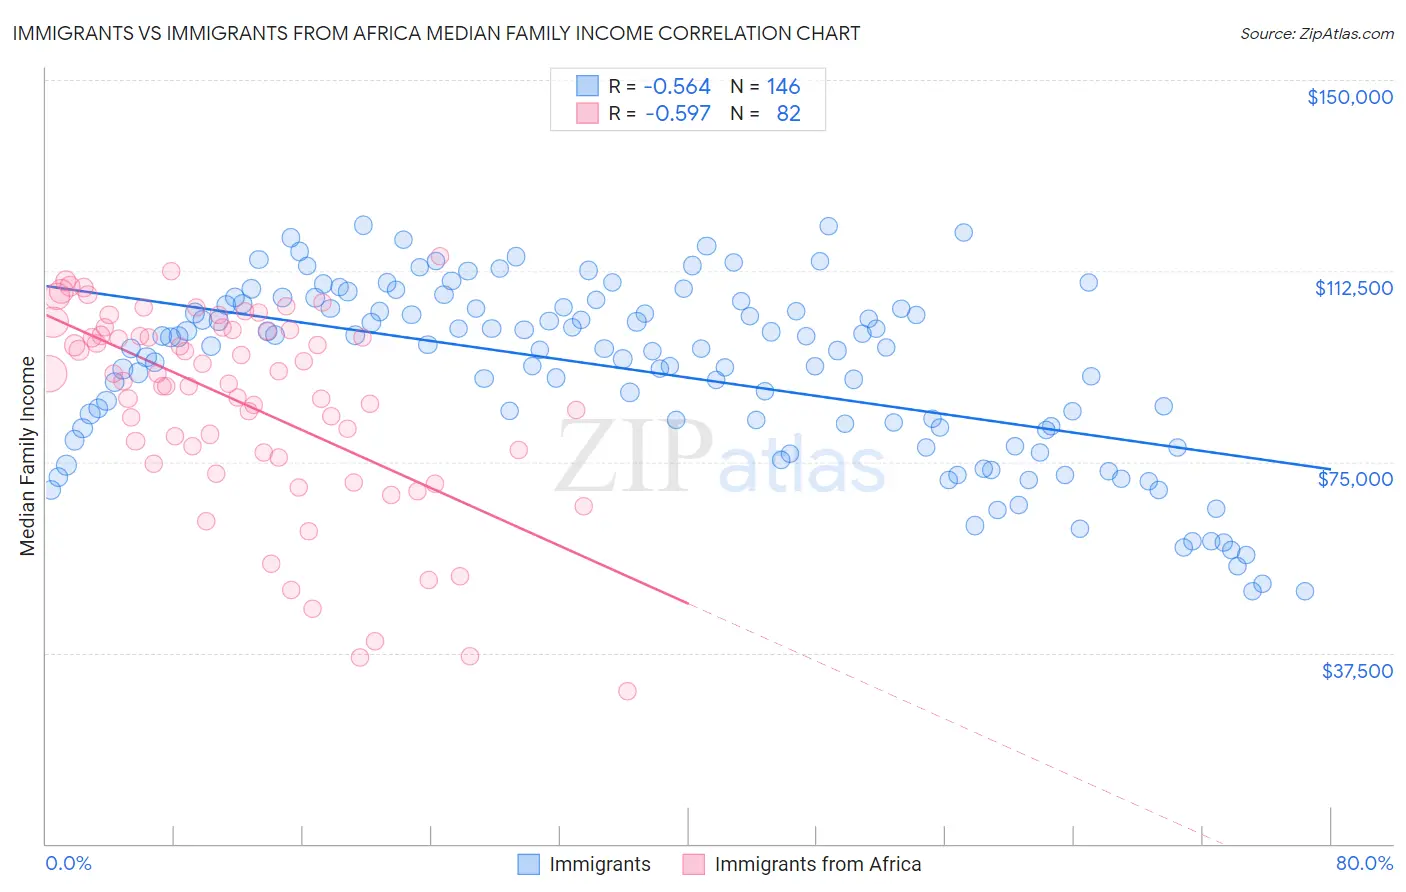
Immigrants vs Immigrants from Africa Median Family Income Correlation Chart
The statistical analysis conducted on geographies consisting of 575,657,782 people shows a substantial negative correlation between the proportion of Immigrants and median family income in the United States with a correlation coefficient (R) of -0.564 and weighted average of $100,962. Similarly, the statistical analysis conducted on geographies consisting of 468,709,431 people shows a substantial negative correlation between the proportion of Immigrants from Africa and median family income in the United States with a correlation coefficient (R) of -0.597 and weighted average of $100,256, a difference of 0.70%.
Median Family Income Correlation Summary
| Measurement | Immigrants | Immigrants from Africa |
| Minimum | $49,547 | $29,978 |
| Maximum | $121,425 | $115,502 |
| Range | $71,878 | $85,524 |
| Mean | $92,890 | $86,633 |
| Median | $97,277 | $91,514 |
| Interquartile 25% (IQ1) | $81,623 | $76,824 |
| Interquartile 75% (IQ3) | $105,367 | $100,972 |
| Interquartile Range (IQR) | $23,744 | $24,148 |
| Standard Deviation (Sample) | $17,448 | $19,648 |
| Standard Deviation (Population) | $17,388 | $19,528 |
Demographics Similar to Immigrants and Immigrants from Africa by Median Family Income
In terms of median family income, the demographic groups most similar to Immigrants are Immigrants from Portugal ($100,984, a difference of 0.020%), Guamanian/Chamorro ($101,061, a difference of 0.10%), Tlingit-Haida ($101,092, a difference of 0.13%), Celtic ($101,139, a difference of 0.18%), and Colombian ($100,750, a difference of 0.21%). Similarly, the demographic groups most similar to Immigrants from Africa are Immigrants from Cameroon ($100,289, a difference of 0.030%), Samoan ($100,344, a difference of 0.090%), Yugoslavian ($100,119, a difference of 0.14%), Immigrants from South America ($100,414, a difference of 0.16%), and Spanish ($99,977, a difference of 0.28%).
| Demographics | Rating | Rank | Median Family Income |
| Immigrants | Costa Rica | 33.7 /100 | #184 | Fair $101,354 |
| Dutch | 31.9 /100 | #185 | Fair $101,192 |
| Celtics | 31.3 /100 | #186 | Fair $101,139 |
| Tlingit-Haida | 30.8 /100 | #187 | Fair $101,092 |
| Guamanians/Chamorros | 30.5 /100 | #188 | Fair $101,061 |
| Immigrants | Portugal | 29.6 /100 | #189 | Fair $100,984 |
| Immigrants | Immigrants | 29.4 /100 | #190 | Fair $100,962 |
| Colombians | 27.2 /100 | #191 | Fair $100,750 |
| Immigrants | Kenya | 26.5 /100 | #192 | Fair $100,679 |
| Iraqis | 26.3 /100 | #193 | Fair $100,658 |
| Uruguayans | 26.3 /100 | #194 | Fair $100,656 |
| Immigrants | South America | 23.9 /100 | #195 | Fair $100,414 |
| Samoans | 23.3 /100 | #196 | Fair $100,344 |
| Immigrants | Cameroon | 22.8 /100 | #197 | Fair $100,289 |
| Immigrants | Africa | 22.5 /100 | #198 | Fair $100,256 |
| Yugoslavians | 21.3 /100 | #199 | Fair $100,119 |
| Spanish | 20.1 /100 | #200 | Fair $99,977 |
| Immigrants | Thailand | 19.0 /100 | #201 | Poor $99,840 |
| Whites/Caucasians | 18.7 /100 | #202 | Poor $99,800 |
| Scotch-Irish | 17.1 /100 | #203 | Poor $99,591 |
| Ghanaians | 12.6 /100 | #204 | Poor $98,877 |