Asian vs Immigrants from Africa Ambulatory Disability
COMPARE
Asian
Immigrants from Africa
Ambulatory Disability
Ambulatory Disability Comparison
Asians
Immigrants from Africa
5.4%
AMBULATORY DISABILITY
100.0/ 100
METRIC RATING
27th/ 347
METRIC RANK
5.9%
AMBULATORY DISABILITY
94.7/ 100
METRIC RATING
116th/ 347
METRIC RANK
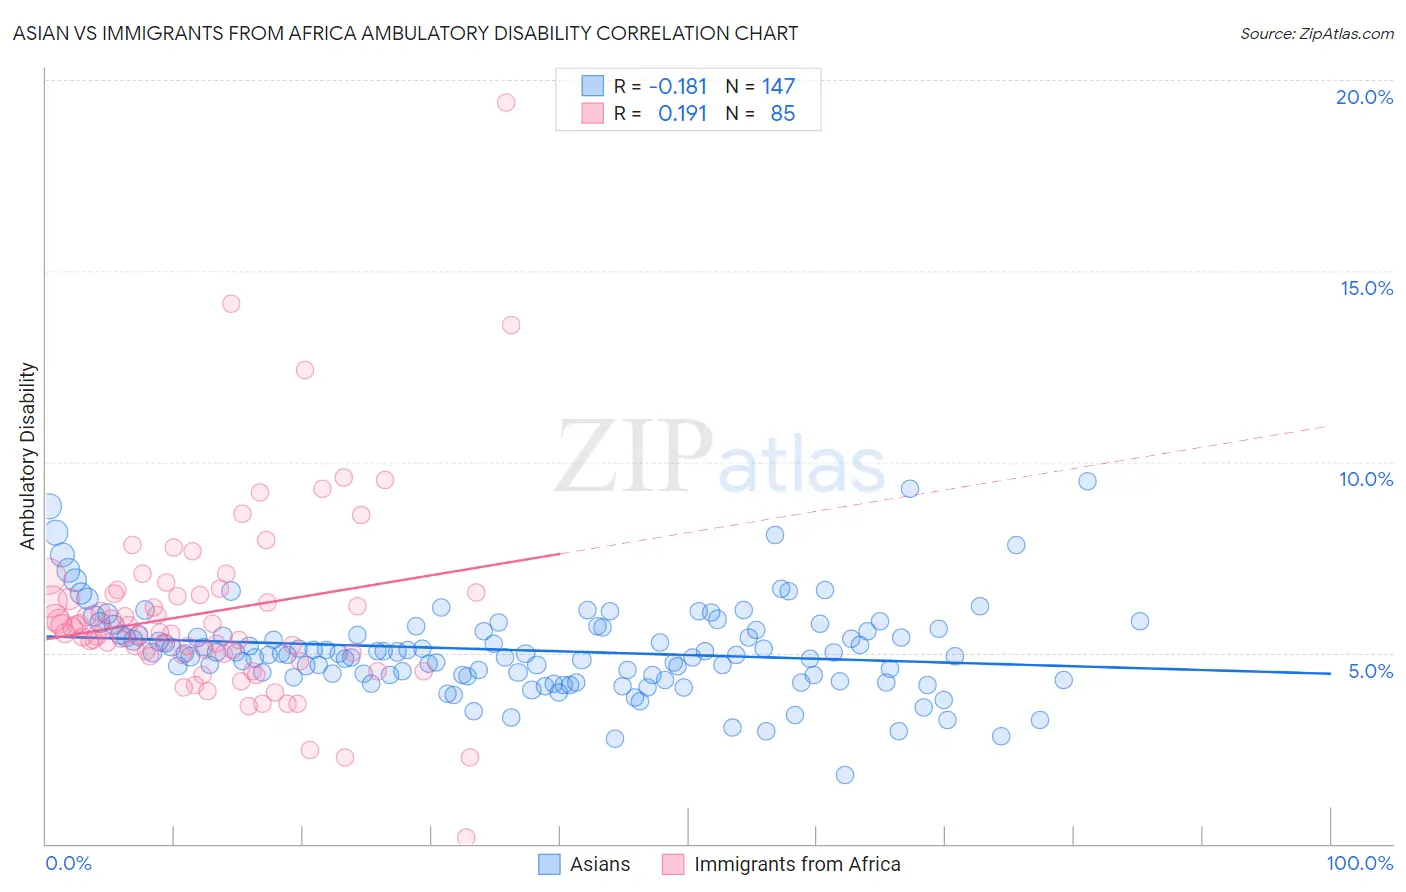
Asian vs Immigrants from Africa Ambulatory Disability Correlation Chart
The statistical analysis conducted on geographies consisting of 550,442,799 people shows a poor negative correlation between the proportion of Asians and percentage of population with ambulatory disability in the United States with a correlation coefficient (R) of -0.181 and weighted average of 5.4%. Similarly, the statistical analysis conducted on geographies consisting of 469,140,674 people shows a poor positive correlation between the proportion of Immigrants from Africa and percentage of population with ambulatory disability in the United States with a correlation coefficient (R) of 0.191 and weighted average of 5.9%, a difference of 8.9%.
Ambulatory Disability Correlation Summary
| Measurement | Asian | Immigrants from Africa |
| Minimum | 1.8% | 0.17% |
| Maximum | 9.5% | 19.4% |
| Range | 7.7% | 19.2% |
| Mean | 5.1% | 6.1% |
| Median | 5.0% | 5.6% |
| Interquartile 25% (IQ1) | 4.4% | 5.0% |
| Interquartile 75% (IQ3) | 5.6% | 6.6% |
| Interquartile Range (IQR) | 1.2% | 1.6% |
| Standard Deviation (Sample) | 1.2% | 2.6% |
| Standard Deviation (Population) | 1.2% | 2.6% |
Similar Demographics by Ambulatory Disability
Demographics Similar to Asians by Ambulatory Disability
In terms of ambulatory disability, the demographic groups most similar to Asians are Cambodian (5.4%, a difference of 0.060%), Immigrants from Nepal (5.4%, a difference of 0.16%), Immigrants from Iran (5.4%, a difference of 0.16%), Zimbabwean (5.4%, a difference of 0.19%), and Immigrants from Saudi Arabia (5.4%, a difference of 0.27%).
| Demographics | Rating | Rank | Ambulatory Disability |
| Ethiopians | 100.0 /100 | #20 | Exceptional 5.4% |
| Immigrants | Kuwait | 100.0 /100 | #21 | Exceptional 5.4% |
| Immigrants | Israel | 100.0 /100 | #22 | Exceptional 5.4% |
| Tongans | 100.0 /100 | #23 | Exceptional 5.4% |
| Immigrants | Saudi Arabia | 100.0 /100 | #24 | Exceptional 5.4% |
| Zimbabweans | 100.0 /100 | #25 | Exceptional 5.4% |
| Immigrants | Nepal | 100.0 /100 | #26 | Exceptional 5.4% |
| Asians | 100.0 /100 | #27 | Exceptional 5.4% |
| Cambodians | 100.0 /100 | #28 | Exceptional 5.4% |
| Immigrants | Iran | 100.0 /100 | #29 | Exceptional 5.4% |
| Immigrants | Turkey | 100.0 /100 | #30 | Exceptional 5.4% |
| Immigrants | Venezuela | 100.0 /100 | #31 | Exceptional 5.4% |
| Immigrants | Australia | 100.0 /100 | #32 | Exceptional 5.5% |
| Immigrants | Pakistan | 100.0 /100 | #33 | Exceptional 5.5% |
| Immigrants | Asia | 100.0 /100 | #34 | Exceptional 5.5% |
Demographics Similar to Immigrants from Africa by Ambulatory Disability
In terms of ambulatory disability, the demographic groups most similar to Immigrants from Africa are South American Indian (5.9%, a difference of 0.010%), Immigrants from Poland (5.9%, a difference of 0.22%), Immigrants from Uruguay (5.9%, a difference of 0.28%), Immigrants from South Eastern Asia (5.9%, a difference of 0.28%), and Russian (5.9%, a difference of 0.32%).
| Demographics | Rating | Rank | Ambulatory Disability |
| Immigrants | Netherlands | 97.1 /100 | #109 | Exceptional 5.8% |
| Immigrants | Colombia | 96.7 /100 | #110 | Exceptional 5.8% |
| Danes | 96.6 /100 | #111 | Exceptional 5.8% |
| South Africans | 96.3 /100 | #112 | Exceptional 5.9% |
| Immigrants | Uruguay | 95.6 /100 | #113 | Exceptional 5.9% |
| Immigrants | Poland | 95.4 /100 | #114 | Exceptional 5.9% |
| South American Indians | 94.8 /100 | #115 | Exceptional 5.9% |
| Immigrants | Africa | 94.7 /100 | #116 | Exceptional 5.9% |
| Immigrants | South Eastern Asia | 93.6 /100 | #117 | Exceptional 5.9% |
| Russians | 93.4 /100 | #118 | Exceptional 5.9% |
| Norwegians | 93.1 /100 | #119 | Exceptional 5.9% |
| Estonians | 92.9 /100 | #120 | Exceptional 5.9% |
| Costa Ricans | 92.6 /100 | #121 | Exceptional 5.9% |
| Icelanders | 92.6 /100 | #122 | Exceptional 5.9% |
| Immigrants | Russia | 92.4 /100 | #123 | Exceptional 5.9% |