Immigrants from Zimbabwe vs Assyrian/Chaldean/Syriac Ambulatory Disability
COMPARE
Immigrants from Zimbabwe
Assyrian/Chaldean/Syriac
Ambulatory Disability
Ambulatory Disability Comparison
Immigrants from Zimbabwe
Assyrians/Chaldeans/Syriacs
5.6%
AMBULATORY DISABILITY
99.8/ 100
METRIC RATING
58th/ 347
METRIC RANK
6.4%
AMBULATORY DISABILITY
2.4/ 100
METRIC RATING
232nd/ 347
METRIC RANK
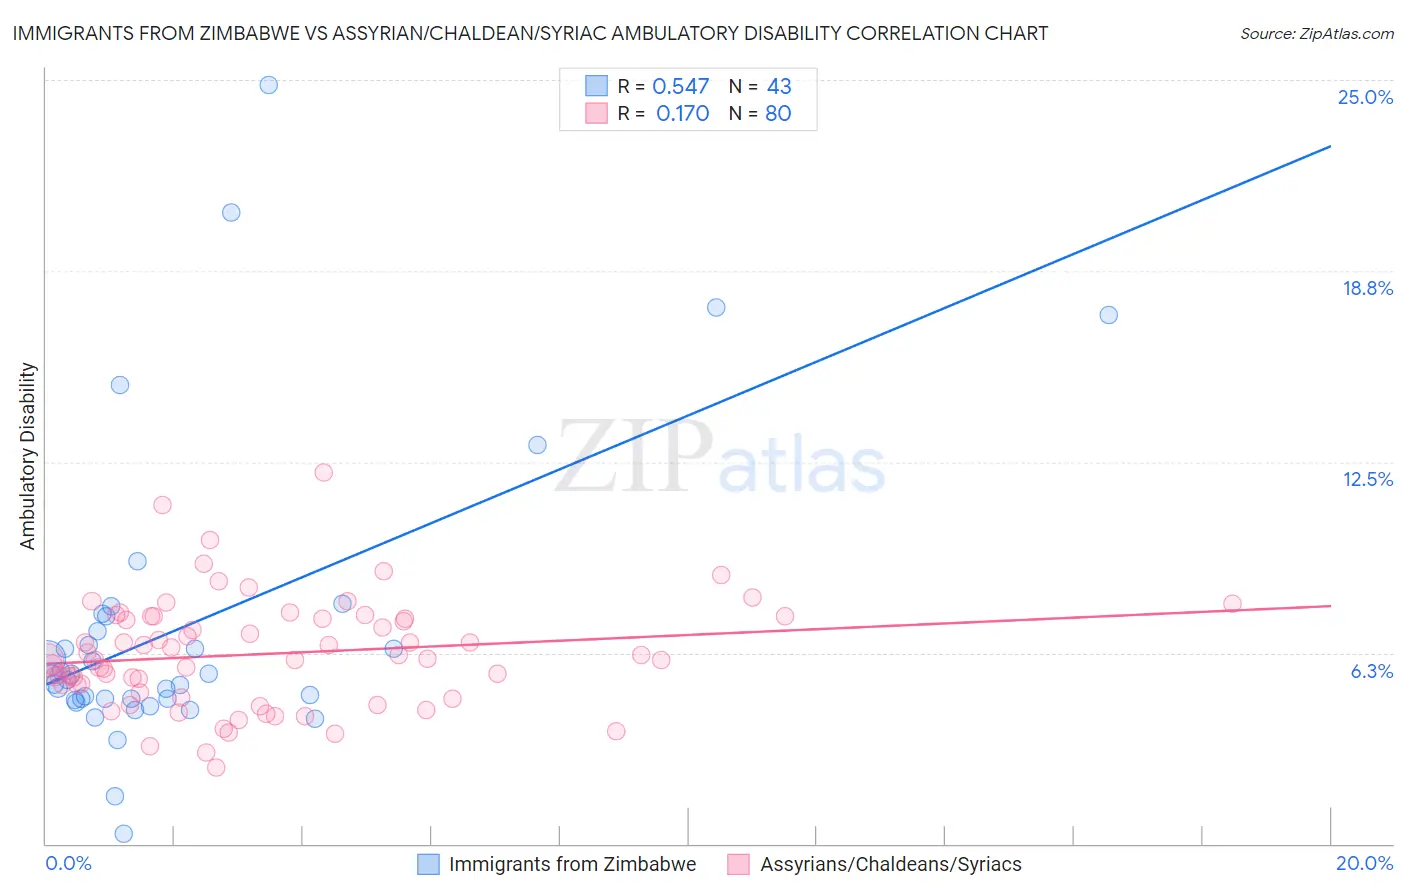
Immigrants from Zimbabwe vs Assyrian/Chaldean/Syriac Ambulatory Disability Correlation Chart
The statistical analysis conducted on geographies consisting of 117,792,147 people shows a substantial positive correlation between the proportion of Immigrants from Zimbabwe and percentage of population with ambulatory disability in the United States with a correlation coefficient (R) of 0.547 and weighted average of 5.6%. Similarly, the statistical analysis conducted on geographies consisting of 110,309,207 people shows a poor positive correlation between the proportion of Assyrians/Chaldeans/Syriacs and percentage of population with ambulatory disability in the United States with a correlation coefficient (R) of 0.170 and weighted average of 6.4%, a difference of 14.0%.
Ambulatory Disability Correlation Summary
| Measurement | Immigrants from Zimbabwe | Assyrian/Chaldean/Syriac |
| Minimum | 0.34% | 2.5% |
| Maximum | 24.9% | 12.1% |
| Range | 24.5% | 9.7% |
| Mean | 7.1% | 6.2% |
| Median | 5.5% | 6.1% |
| Interquartile 25% (IQ1) | 4.7% | 5.1% |
| Interquartile 75% (IQ3) | 7.5% | 7.4% |
| Interquartile Range (IQR) | 2.7% | 2.3% |
| Standard Deviation (Sample) | 4.9% | 1.8% |
| Standard Deviation (Population) | 4.9% | 1.8% |
Similar Demographics by Ambulatory Disability
Demographics Similar to Immigrants from Zimbabwe by Ambulatory Disability
In terms of ambulatory disability, the demographic groups most similar to Immigrants from Zimbabwe are Immigrants from Afghanistan (5.6%, a difference of 0.040%), Immigrants from Brazil (5.6%, a difference of 0.060%), Immigrants from Lithuania (5.6%, a difference of 0.080%), Immigrants from Belgium (5.6%, a difference of 0.20%), and Immigrants from Spain (5.6%, a difference of 0.21%).
| Demographics | Rating | Rank | Ambulatory Disability |
| Taiwanese | 99.8 /100 | #51 | Exceptional 5.6% |
| Jordanians | 99.8 /100 | #52 | Exceptional 5.6% |
| Immigrants | Egypt | 99.8 /100 | #53 | Exceptional 5.6% |
| Immigrants | Eastern Africa | 99.8 /100 | #54 | Exceptional 5.6% |
| Immigrants | Bulgaria | 99.8 /100 | #55 | Exceptional 5.6% |
| Inupiat | 99.8 /100 | #56 | Exceptional 5.6% |
| Immigrants | Brazil | 99.8 /100 | #57 | Exceptional 5.6% |
| Immigrants | Zimbabwe | 99.8 /100 | #58 | Exceptional 5.6% |
| Immigrants | Afghanistan | 99.8 /100 | #59 | Exceptional 5.6% |
| Immigrants | Lithuania | 99.8 /100 | #60 | Exceptional 5.6% |
| Immigrants | Belgium | 99.7 /100 | #61 | Exceptional 5.6% |
| Immigrants | Spain | 99.7 /100 | #62 | Exceptional 5.6% |
| Immigrants | France | 99.7 /100 | #63 | Exceptional 5.6% |
| Laotians | 99.7 /100 | #64 | Exceptional 5.7% |
| Immigrants | Switzerland | 99.7 /100 | #65 | Exceptional 5.7% |
Demographics Similar to Assyrians/Chaldeans/Syriacs by Ambulatory Disability
In terms of ambulatory disability, the demographic groups most similar to Assyrians/Chaldeans/Syriacs are Subsaharan African (6.4%, a difference of 0.060%), Immigrants from Liberia (6.4%, a difference of 0.090%), Hispanic or Latino (6.4%, a difference of 0.12%), Dutch (6.4%, a difference of 0.27%), and Panamanian (6.4%, a difference of 0.33%).
| Demographics | Rating | Rank | Ambulatory Disability |
| Hondurans | 6.3 /100 | #225 | Tragic 6.3% |
| Slavs | 5.1 /100 | #226 | Tragic 6.4% |
| Cubans | 4.0 /100 | #227 | Tragic 6.4% |
| Portuguese | 4.0 /100 | #228 | Tragic 6.4% |
| Czechoslovakians | 3.8 /100 | #229 | Tragic 6.4% |
| Mexicans | 3.5 /100 | #230 | Tragic 6.4% |
| Panamanians | 3.1 /100 | #231 | Tragic 6.4% |
| Assyrians/Chaldeans/Syriacs | 2.4 /100 | #232 | Tragic 6.4% |
| Sub-Saharan Africans | 2.3 /100 | #233 | Tragic 6.4% |
| Immigrants | Liberia | 2.3 /100 | #234 | Tragic 6.4% |
| Hispanics or Latinos | 2.2 /100 | #235 | Tragic 6.4% |
| Dutch | 2.0 /100 | #236 | Tragic 6.4% |
| Immigrants | Germany | 1.8 /100 | #237 | Tragic 6.4% |
| Haitians | 1.8 /100 | #238 | Tragic 6.4% |
| Senegalese | 1.7 /100 | #239 | Tragic 6.4% |