Immigrants from Zimbabwe vs Jamaican Female Disability
COMPARE
Immigrants from Zimbabwe
Jamaican
Female Disability
Female Disability Comparison
Immigrants from Zimbabwe
Jamaicans
11.6%
FEMALE DISABILITY
99.5/ 100
METRIC RATING
91st/ 347
METRIC RANK
12.7%
FEMALE DISABILITY
1.4/ 100
METRIC RATING
253rd/ 347
METRIC RANK
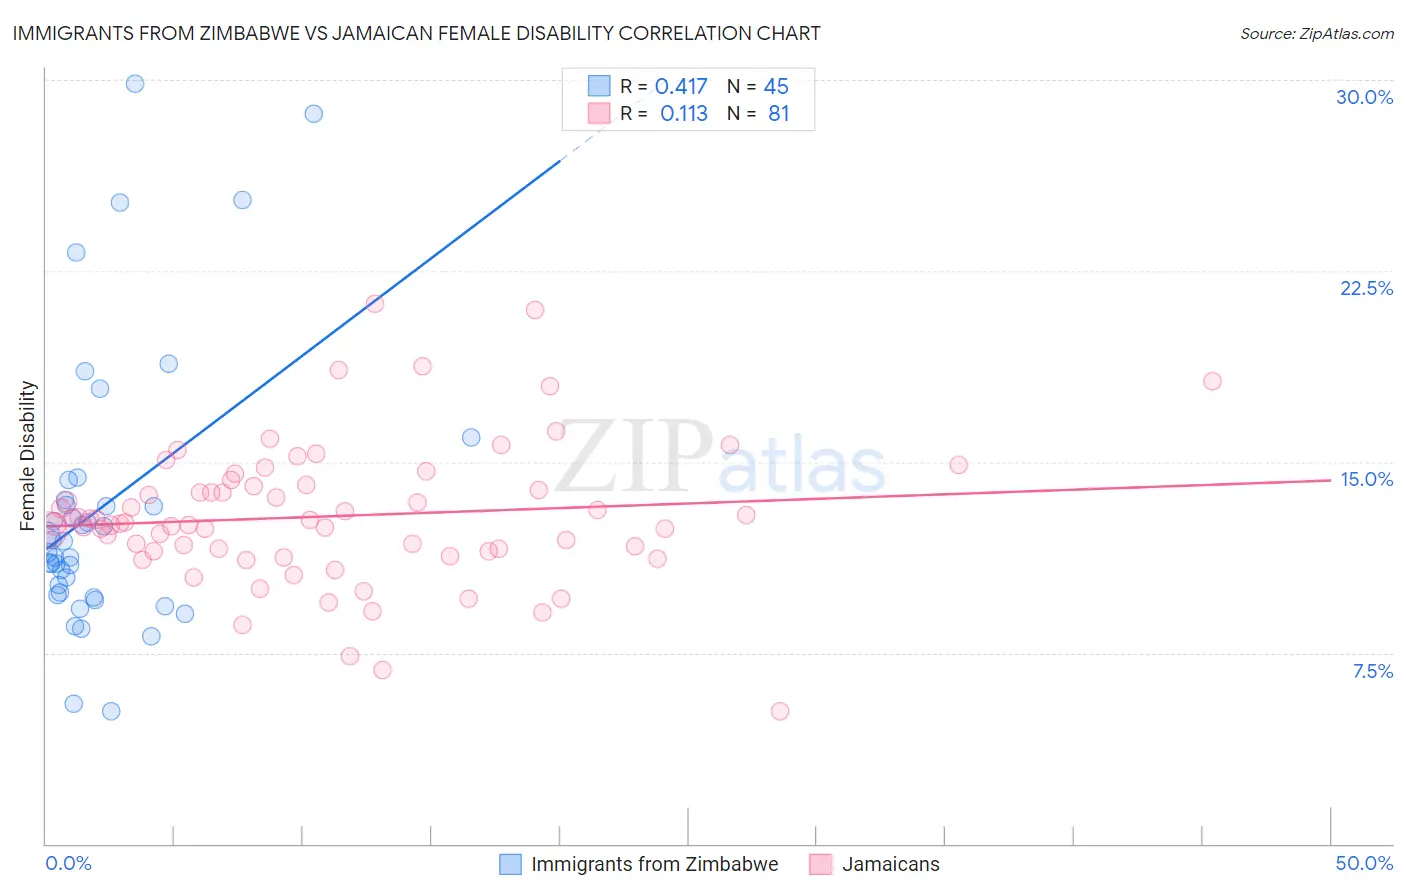
Immigrants from Zimbabwe vs Jamaican Female Disability Correlation Chart
The statistical analysis conducted on geographies consisting of 117,810,271 people shows a moderate positive correlation between the proportion of Immigrants from Zimbabwe and percentage of females with a disability in the United States with a correlation coefficient (R) of 0.417 and weighted average of 11.6%. Similarly, the statistical analysis conducted on geographies consisting of 367,961,325 people shows a poor positive correlation between the proportion of Jamaicans and percentage of females with a disability in the United States with a correlation coefficient (R) of 0.113 and weighted average of 12.7%, a difference of 9.4%.
Female Disability Correlation Summary
| Measurement | Immigrants from Zimbabwe | Jamaican |
| Minimum | 5.2% | 5.2% |
| Maximum | 29.8% | 21.2% |
| Range | 24.6% | 16.0% |
| Mean | 13.2% | 12.9% |
| Median | 11.9% | 12.6% |
| Interquartile 25% (IQ1) | 9.8% | 11.5% |
| Interquartile 75% (IQ3) | 13.9% | 14.1% |
| Interquartile Range (IQR) | 4.0% | 2.6% |
| Standard Deviation (Sample) | 5.5% | 2.8% |
| Standard Deviation (Population) | 5.5% | 2.7% |
Similar Demographics by Female Disability
Demographics Similar to Immigrants from Zimbabwe by Female Disability
In terms of female disability, the demographic groups most similar to Immigrants from Zimbabwe are Vietnamese (11.6%, a difference of 0.010%), Immigrants from Romania (11.6%, a difference of 0.010%), Immigrants from Czechoslovakia (11.6%, a difference of 0.010%), Immigrants from Denmark (11.6%, a difference of 0.11%), and Yup'ik (11.6%, a difference of 0.11%).
| Demographics | Rating | Rank | Female Disability |
| Immigrants | Poland | 99.6 /100 | #84 | Exceptional 11.6% |
| Palestinians | 99.6 /100 | #85 | Exceptional 11.6% |
| Immigrants | Cameroon | 99.6 /100 | #86 | Exceptional 11.6% |
| Immigrants | Denmark | 99.5 /100 | #87 | Exceptional 11.6% |
| Yup'ik | 99.5 /100 | #88 | Exceptional 11.6% |
| Vietnamese | 99.5 /100 | #89 | Exceptional 11.6% |
| Immigrants | Romania | 99.5 /100 | #90 | Exceptional 11.6% |
| Immigrants | Zimbabwe | 99.5 /100 | #91 | Exceptional 11.6% |
| Immigrants | Czechoslovakia | 99.5 /100 | #92 | Exceptional 11.6% |
| Immigrants | Sierra Leone | 99.4 /100 | #93 | Exceptional 11.6% |
| Immigrants | Brazil | 99.4 /100 | #94 | Exceptional 11.6% |
| Immigrants | Northern Europe | 99.4 /100 | #95 | Exceptional 11.6% |
| Immigrants | Russia | 99.0 /100 | #96 | Exceptional 11.7% |
| Koreans | 99.0 /100 | #97 | Exceptional 11.7% |
| Uruguayans | 98.8 /100 | #98 | Exceptional 11.7% |
Demographics Similar to Jamaicans by Female Disability
In terms of female disability, the demographic groups most similar to Jamaicans are Immigrants from Caribbean (12.7%, a difference of 0.010%), Hawaiian (12.7%, a difference of 0.030%), Crow (12.7%, a difference of 0.090%), Immigrants from Germany (12.7%, a difference of 0.11%), and Slovene (12.7%, a difference of 0.15%).
| Demographics | Rating | Rank | Female Disability |
| Spanish American Indians | 2.1 /100 | #246 | Tragic 12.6% |
| Menominee | 2.1 /100 | #247 | Tragic 12.6% |
| Carpatho Rusyns | 2.0 /100 | #248 | Tragic 12.6% |
| Immigrants | Congo | 1.8 /100 | #249 | Tragic 12.7% |
| Slovenes | 1.7 /100 | #250 | Tragic 12.7% |
| Crow | 1.6 /100 | #251 | Tragic 12.7% |
| Immigrants | Caribbean | 1.4 /100 | #252 | Tragic 12.7% |
| Jamaicans | 1.4 /100 | #253 | Tragic 12.7% |
| Hawaiians | 1.4 /100 | #254 | Tragic 12.7% |
| Immigrants | Germany | 1.3 /100 | #255 | Tragic 12.7% |
| British West Indians | 1.2 /100 | #256 | Tragic 12.7% |
| Liberians | 1.1 /100 | #257 | Tragic 12.7% |
| Aleuts | 1.1 /100 | #258 | Tragic 12.7% |
| Immigrants | Armenia | 1.0 /100 | #259 | Tragic 12.7% |
| Sub-Saharan Africans | 1.0 /100 | #260 | Tragic 12.7% |