Immigrants from Zaire vs Native Hawaiian Master's Degree
COMPARE
Immigrants from Zaire
Native Hawaiian
Master's Degree
Master's Degree Comparison
Immigrants from Zaire
Native Hawaiians
14.7%
MASTER'S DEGREE
39.5/ 100
METRIC RATING
184th/ 347
METRIC RANK
12.3%
MASTER'S DEGREE
0.4/ 100
METRIC RATING
268th/ 347
METRIC RANK
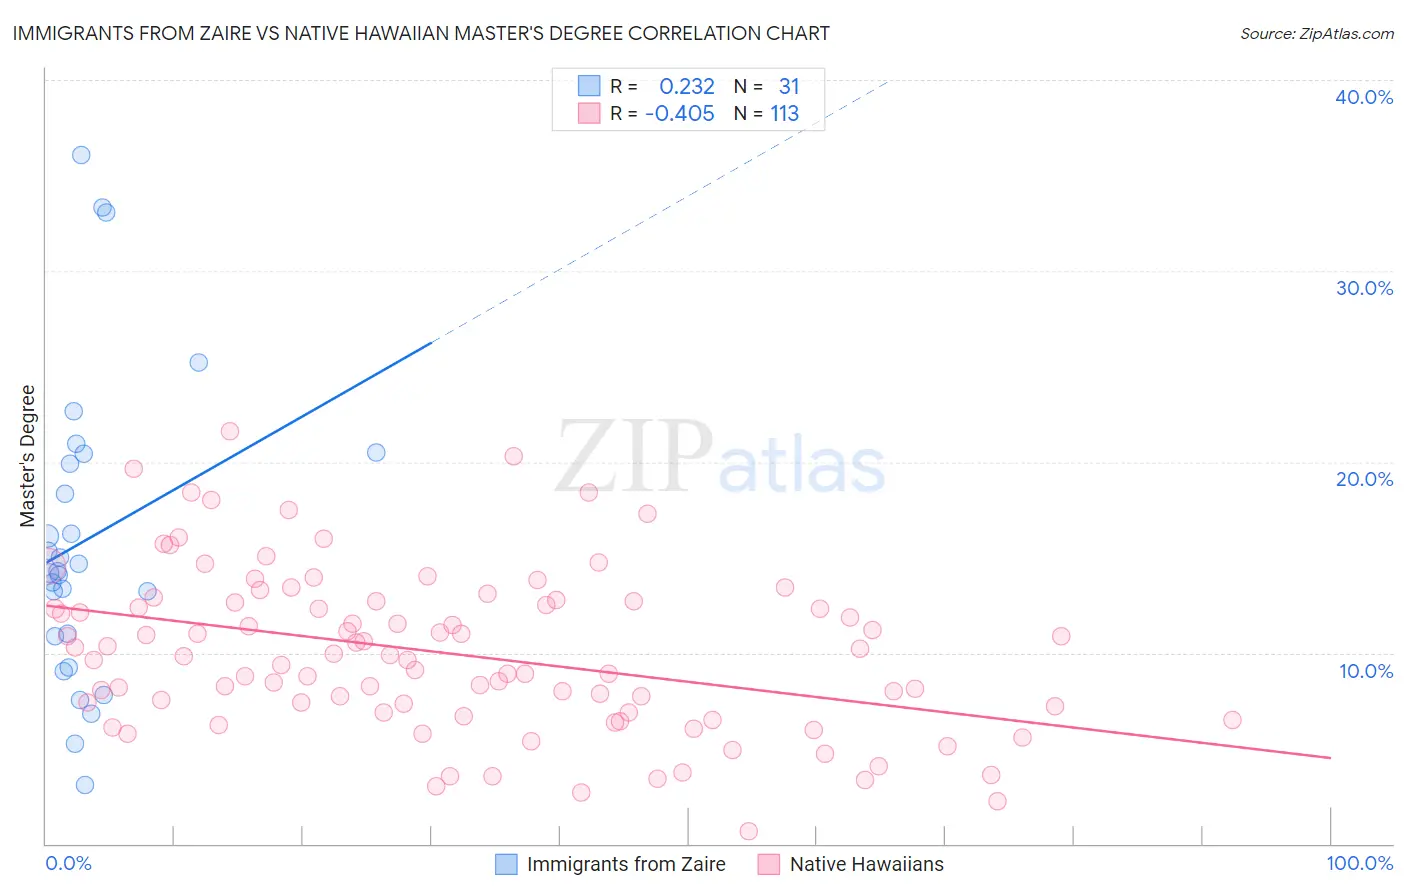
Immigrants from Zaire vs Native Hawaiian Master's Degree Correlation Chart
The statistical analysis conducted on geographies consisting of 107,246,977 people shows a weak positive correlation between the proportion of Immigrants from Zaire and percentage of population with at least master's degree education in the United States with a correlation coefficient (R) of 0.232 and weighted average of 14.7%. Similarly, the statistical analysis conducted on geographies consisting of 331,993,675 people shows a moderate negative correlation between the proportion of Native Hawaiians and percentage of population with at least master's degree education in the United States with a correlation coefficient (R) of -0.405 and weighted average of 12.3%, a difference of 19.9%.
Master's Degree Correlation Summary
| Measurement | Immigrants from Zaire | Native Hawaiian |
| Minimum | 3.1% | 0.67% |
| Maximum | 36.1% | 21.6% |
| Range | 33.0% | 20.9% |
| Mean | 15.9% | 10.0% |
| Median | 14.3% | 9.8% |
| Interquartile 25% (IQ1) | 10.9% | 6.9% |
| Interquartile 75% (IQ3) | 20.4% | 12.7% |
| Interquartile Range (IQR) | 9.6% | 5.8% |
| Standard Deviation (Sample) | 8.0% | 4.2% |
| Standard Deviation (Population) | 7.8% | 4.2% |
Similar Demographics by Master's Degree
Demographics Similar to Immigrants from Zaire by Master's Degree
In terms of master's degree, the demographic groups most similar to Immigrants from Zaire are Sri Lankan (14.7%, a difference of 0.020%), Czech (14.7%, a difference of 0.12%), Barbadian (14.7%, a difference of 0.16%), Swiss (14.7%, a difference of 0.22%), and Immigrants from Iraq (14.8%, a difference of 0.25%).
| Demographics | Rating | Rank | Master's Degree |
| Immigrants | Colombia | 48.3 /100 | #177 | Average 14.9% |
| English | 45.0 /100 | #178 | Average 14.8% |
| Immigrants | Iraq | 41.3 /100 | #179 | Average 14.8% |
| Celtics | 41.3 /100 | #180 | Average 14.8% |
| Swiss | 41.1 /100 | #181 | Average 14.7% |
| Czechs | 40.4 /100 | #182 | Average 14.7% |
| Sri Lankans | 39.6 /100 | #183 | Fair 14.7% |
| Immigrants | Zaire | 39.5 /100 | #184 | Fair 14.7% |
| Barbadians | 38.3 /100 | #185 | Fair 14.7% |
| Immigrants | Oceania | 37.1 /100 | #186 | Fair 14.7% |
| Basques | 36.5 /100 | #187 | Fair 14.7% |
| Immigrants | Costa Rica | 36.2 /100 | #188 | Fair 14.7% |
| Immigrants | Immigrants | 36.0 /100 | #189 | Fair 14.6% |
| Spaniards | 35.8 /100 | #190 | Fair 14.6% |
| Welsh | 34.2 /100 | #191 | Fair 14.6% |
Demographics Similar to Native Hawaiians by Master's Degree
In terms of master's degree, the demographic groups most similar to Native Hawaiians are American (12.3%, a difference of 0.25%), Central American (12.2%, a difference of 0.65%), Salvadoran (12.2%, a difference of 0.78%), Bahamian (12.4%, a difference of 1.0%), and Immigrants from Fiji (12.4%, a difference of 1.2%).
| Demographics | Rating | Rank | Master's Degree |
| Tongans | 0.6 /100 | #261 | Tragic 12.5% |
| Nicaraguans | 0.6 /100 | #262 | Tragic 12.5% |
| Central American Indians | 0.5 /100 | #263 | Tragic 12.4% |
| Belizeans | 0.5 /100 | #264 | Tragic 12.4% |
| Immigrants | Fiji | 0.5 /100 | #265 | Tragic 12.4% |
| Bahamians | 0.5 /100 | #266 | Tragic 12.4% |
| Americans | 0.4 /100 | #267 | Tragic 12.3% |
| Native Hawaiians | 0.4 /100 | #268 | Tragic 12.3% |
| Central Americans | 0.3 /100 | #269 | Tragic 12.2% |
| Salvadorans | 0.3 /100 | #270 | Tragic 12.2% |
| Haitians | 0.3 /100 | #271 | Tragic 12.1% |
| Comanche | 0.3 /100 | #272 | Tragic 12.1% |
| Blackfeet | 0.3 /100 | #273 | Tragic 12.1% |
| Cape Verdeans | 0.3 /100 | #274 | Tragic 12.1% |
| Cubans | 0.3 /100 | #275 | Tragic 12.1% |