Immigrants from Nicaragua vs Native Hawaiian Female Disability
COMPARE
Immigrants from Nicaragua
Native Hawaiian
Female Disability
Female Disability Comparison
Immigrants from Nicaragua
Native Hawaiians
11.9%
FEMALE DISABILITY
94.5/ 100
METRIC RATING
134th/ 347
METRIC RANK
12.4%
FEMALE DISABILITY
10.8/ 100
METRIC RATING
221st/ 347
METRIC RANK
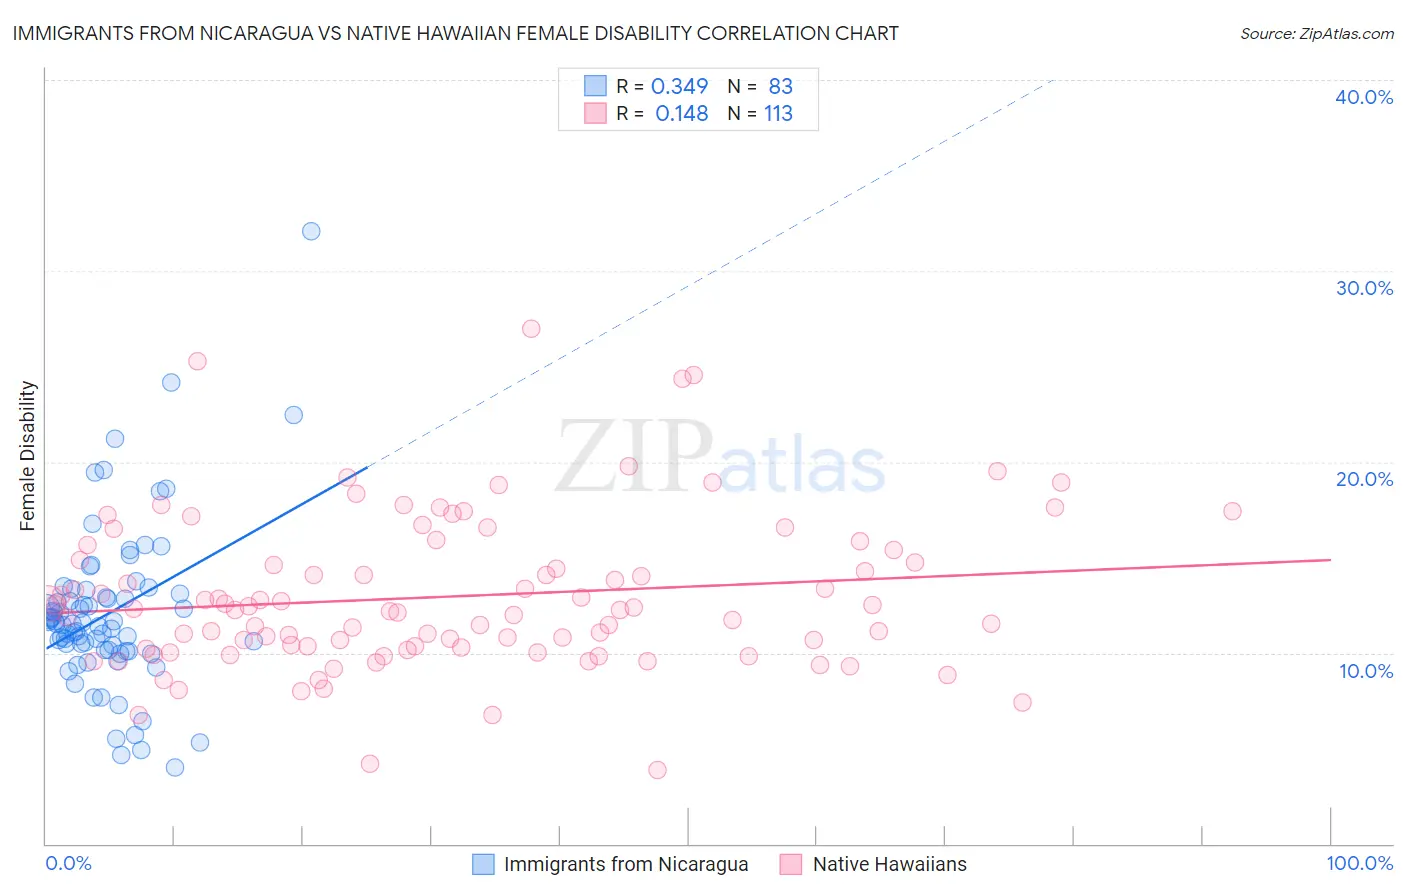
Immigrants from Nicaragua vs Native Hawaiian Female Disability Correlation Chart
The statistical analysis conducted on geographies consisting of 236,326,284 people shows a mild positive correlation between the proportion of Immigrants from Nicaragua and percentage of females with a disability in the United States with a correlation coefficient (R) of 0.349 and weighted average of 11.9%. Similarly, the statistical analysis conducted on geographies consisting of 332,017,231 people shows a poor positive correlation between the proportion of Native Hawaiians and percentage of females with a disability in the United States with a correlation coefficient (R) of 0.148 and weighted average of 12.4%, a difference of 4.8%.
Female Disability Correlation Summary
| Measurement | Immigrants from Nicaragua | Native Hawaiian |
| Minimum | 4.0% | 3.9% |
| Maximum | 32.1% | 27.0% |
| Range | 28.0% | 23.1% |
| Mean | 12.1% | 13.0% |
| Median | 11.5% | 12.3% |
| Interquartile 25% (IQ1) | 10.1% | 10.3% |
| Interquartile 75% (IQ3) | 13.1% | 15.1% |
| Interquartile Range (IQR) | 2.9% | 4.9% |
| Standard Deviation (Sample) | 4.3% | 4.1% |
| Standard Deviation (Population) | 4.3% | 4.0% |
Similar Demographics by Female Disability
Demographics Similar to Immigrants from Nicaragua by Female Disability
In terms of female disability, the demographic groups most similar to Immigrants from Nicaragua are Kenyan (11.9%, a difference of 0.0%), Immigrants from Syria (11.9%, a difference of 0.010%), Central American (11.9%, a difference of 0.070%), Ugandan (11.9%, a difference of 0.090%), and Arab (11.9%, a difference of 0.11%).
| Demographics | Rating | Rank | Female Disability |
| South American Indians | 95.8 /100 | #127 | Exceptional 11.8% |
| Immigrants | Latvia | 95.6 /100 | #128 | Exceptional 11.8% |
| Macedonians | 95.5 /100 | #129 | Exceptional 11.8% |
| Nicaraguans | 95.2 /100 | #130 | Exceptional 11.9% |
| Arabs | 95.1 /100 | #131 | Exceptional 11.9% |
| Immigrants | Syria | 94.6 /100 | #132 | Exceptional 11.9% |
| Kenyans | 94.5 /100 | #133 | Exceptional 11.9% |
| Immigrants | Nicaragua | 94.5 /100 | #134 | Exceptional 11.9% |
| Central Americans | 94.2 /100 | #135 | Exceptional 11.9% |
| Ugandans | 94.0 /100 | #136 | Exceptional 11.9% |
| Immigrants | Norway | 93.8 /100 | #137 | Exceptional 11.9% |
| Ecuadorians | 93.4 /100 | #138 | Exceptional 11.9% |
| Immigrants | Hungary | 92.8 /100 | #139 | Exceptional 11.9% |
| Romanians | 91.6 /100 | #140 | Exceptional 11.9% |
| Immigrants | Ecuador | 91.5 /100 | #141 | Exceptional 11.9% |
Demographics Similar to Native Hawaiians by Female Disability
In terms of female disability, the demographic groups most similar to Native Hawaiians are Italian (12.4%, a difference of 0.010%), Bahamian (12.4%, a difference of 0.030%), European (12.4%, a difference of 0.12%), Guamanian/Chamorro (12.5%, a difference of 0.14%), and Immigrants from Bahamas (12.4%, a difference of 0.15%).
| Demographics | Rating | Rank | Female Disability |
| Panamanians | 13.5 /100 | #214 | Poor 12.4% |
| Samoans | 13.4 /100 | #215 | Poor 12.4% |
| Immigrants | Burma/Myanmar | 13.3 /100 | #216 | Poor 12.4% |
| British | 12.7 /100 | #217 | Poor 12.4% |
| Immigrants | Bahamas | 12.5 /100 | #218 | Poor 12.4% |
| Europeans | 12.1 /100 | #219 | Poor 12.4% |
| Bahamians | 11.1 /100 | #220 | Poor 12.4% |
| Native Hawaiians | 10.8 /100 | #221 | Poor 12.4% |
| Italians | 10.7 /100 | #222 | Poor 12.4% |
| Guamanians/Chamorros | 9.5 /100 | #223 | Tragic 12.5% |
| Belizeans | 9.3 /100 | #224 | Tragic 12.5% |
| Poles | 8.4 /100 | #225 | Tragic 12.5% |
| Hispanics or Latinos | 8.0 /100 | #226 | Tragic 12.5% |
| Assyrians/Chaldeans/Syriacs | 8.0 /100 | #227 | Tragic 12.5% |
| Immigrants | Cambodia | 7.8 /100 | #228 | Tragic 12.5% |