Mongolian vs Immigrants from Poland Disability
COMPARE
Mongolian
Immigrants from Poland
Disability
Disability Comparison
Mongolians
Immigrants from Poland
10.8%
DISABILITY
99.9/ 100
METRIC RATING
40th/ 347
METRIC RANK
11.1%
DISABILITY
99.1/ 100
METRIC RATING
81st/ 347
METRIC RANK
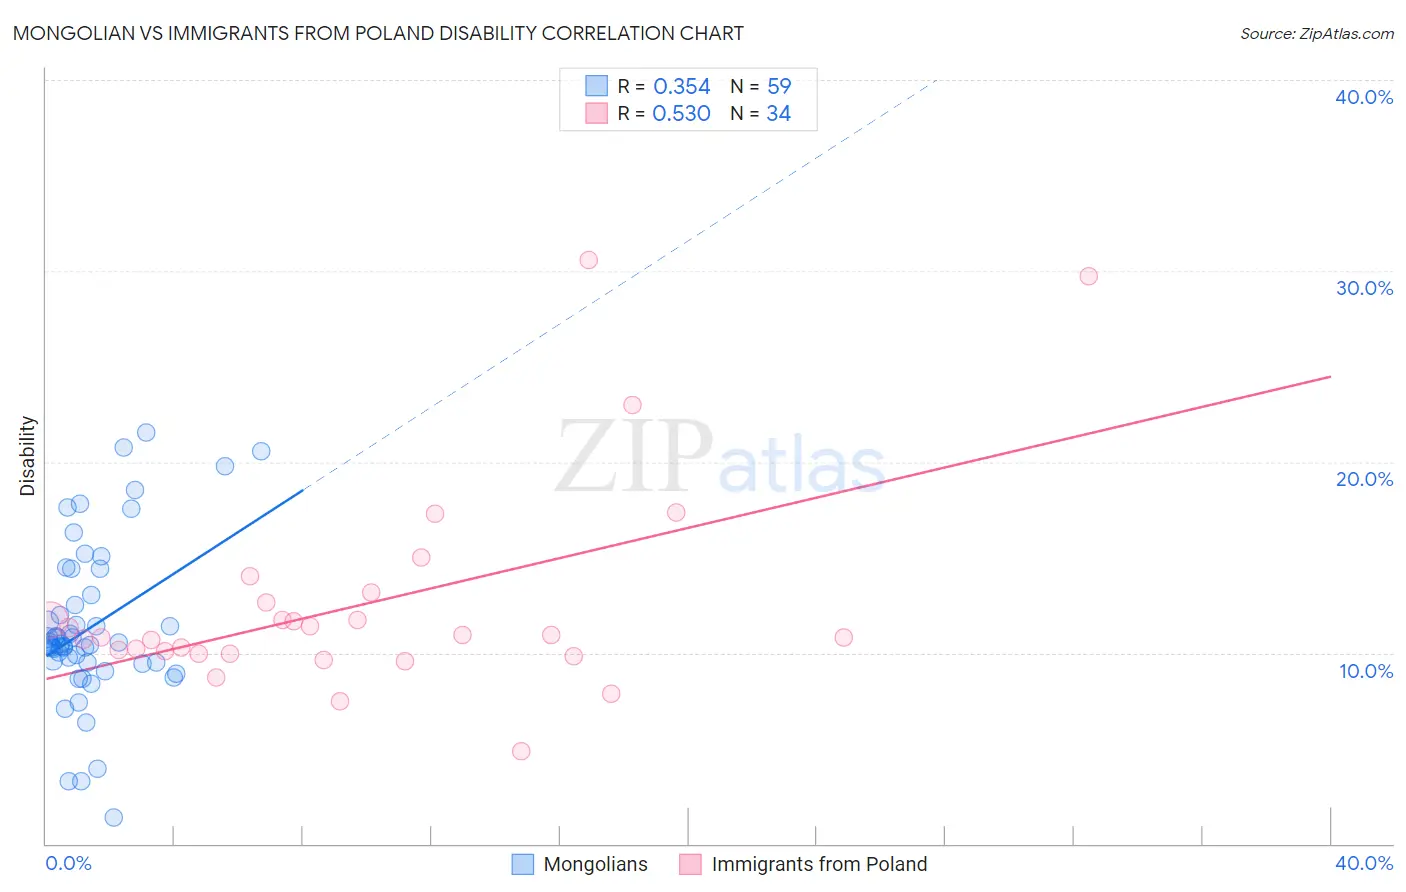
Mongolian vs Immigrants from Poland Disability Correlation Chart
The statistical analysis conducted on geographies consisting of 140,360,971 people shows a mild positive correlation between the proportion of Mongolians and percentage of population with a disability in the United States with a correlation coefficient (R) of 0.354 and weighted average of 10.8%. Similarly, the statistical analysis conducted on geographies consisting of 304,838,062 people shows a substantial positive correlation between the proportion of Immigrants from Poland and percentage of population with a disability in the United States with a correlation coefficient (R) of 0.530 and weighted average of 11.1%, a difference of 3.0%.
Disability Correlation Summary
| Measurement | Mongolian | Immigrants from Poland |
| Minimum | 1.4% | 4.8% |
| Maximum | 21.6% | 30.6% |
| Range | 20.2% | 25.7% |
| Mean | 11.3% | 12.5% |
| Median | 10.5% | 10.9% |
| Interquartile 25% (IQ1) | 9.5% | 10.0% |
| Interquartile 75% (IQ3) | 13.0% | 12.6% |
| Interquartile Range (IQR) | 3.5% | 2.7% |
| Standard Deviation (Sample) | 4.2% | 5.5% |
| Standard Deviation (Population) | 4.2% | 5.4% |
Similar Demographics by Disability
Demographics Similar to Mongolians by Disability
In terms of disability, the demographic groups most similar to Mongolians are Cambodian (10.8%, a difference of 0.0%), Immigrants from Australia (10.8%, a difference of 0.040%), Afghan (10.8%, a difference of 0.10%), Immigrants from Nepal (10.8%, a difference of 0.14%), and Israeli (10.8%, a difference of 0.19%).
| Demographics | Rating | Rank | Disability |
| Immigrants | Kuwait | 100.0 /100 | #33 | Exceptional 10.7% |
| Immigrants | Ethiopia | 100.0 /100 | #34 | Exceptional 10.7% |
| Immigrants | Indonesia | 100.0 /100 | #35 | Exceptional 10.7% |
| Ethiopians | 100.0 /100 | #36 | Exceptional 10.7% |
| Turks | 100.0 /100 | #37 | Exceptional 10.7% |
| Afghans | 99.9 /100 | #38 | Exceptional 10.8% |
| Cambodians | 99.9 /100 | #39 | Exceptional 10.8% |
| Mongolians | 99.9 /100 | #40 | Exceptional 10.8% |
| Immigrants | Australia | 99.9 /100 | #41 | Exceptional 10.8% |
| Immigrants | Nepal | 99.9 /100 | #42 | Exceptional 10.8% |
| Israelis | 99.9 /100 | #43 | Exceptional 10.8% |
| Immigrants | Japan | 99.9 /100 | #44 | Exceptional 10.8% |
| Immigrants | Peru | 99.9 /100 | #45 | Exceptional 10.8% |
| Tongans | 99.9 /100 | #46 | Exceptional 10.8% |
| Taiwanese | 99.9 /100 | #47 | Exceptional 10.8% |
Demographics Similar to Immigrants from Poland by Disability
In terms of disability, the demographic groups most similar to Immigrants from Poland are Chilean (11.1%, a difference of 0.050%), Immigrants from Switzerland (11.1%, a difference of 0.080%), Immigrants from Sierra Leone (11.1%, a difference of 0.090%), Immigrants from Belarus (11.1%, a difference of 0.24%), and Immigrants from Russia (11.1%, a difference of 0.24%).
| Demographics | Rating | Rank | Disability |
| Immigrants | Serbia | 99.4 /100 | #74 | Exceptional 11.0% |
| Immigrants | Vietnam | 99.4 /100 | #75 | Exceptional 11.0% |
| Sierra Leoneans | 99.3 /100 | #76 | Exceptional 11.0% |
| Immigrants | Belgium | 99.3 /100 | #77 | Exceptional 11.0% |
| Immigrants | Cameroon | 99.3 /100 | #78 | Exceptional 11.1% |
| Immigrants | Jordan | 99.3 /100 | #79 | Exceptional 11.1% |
| Immigrants | Ireland | 99.3 /100 | #80 | Exceptional 11.1% |
| Immigrants | Poland | 99.1 /100 | #81 | Exceptional 11.1% |
| Chileans | 99.1 /100 | #82 | Exceptional 11.1% |
| Immigrants | Switzerland | 99.0 /100 | #83 | Exceptional 11.1% |
| Immigrants | Sierra Leone | 99.0 /100 | #84 | Exceptional 11.1% |
| Immigrants | Belarus | 98.9 /100 | #85 | Exceptional 11.1% |
| Immigrants | Russia | 98.9 /100 | #86 | Exceptional 11.1% |
| Palestinians | 98.9 /100 | #87 | Exceptional 11.1% |
| Immigrants | Romania | 98.5 /100 | #88 | Exceptional 11.2% |