Immigrants from Zaire vs Immigrants from Poland Poverty
COMPARE
Immigrants from Zaire
Immigrants from Poland
Poverty
Poverty Comparison
Immigrants from Zaire
Immigrants from Poland
15.1%
POVERTY
0.0/ 100
METRIC RATING
293rd/ 347
METRIC RANK
10.8%
POVERTY
99.4/ 100
METRIC RATING
34th/ 347
METRIC RANK
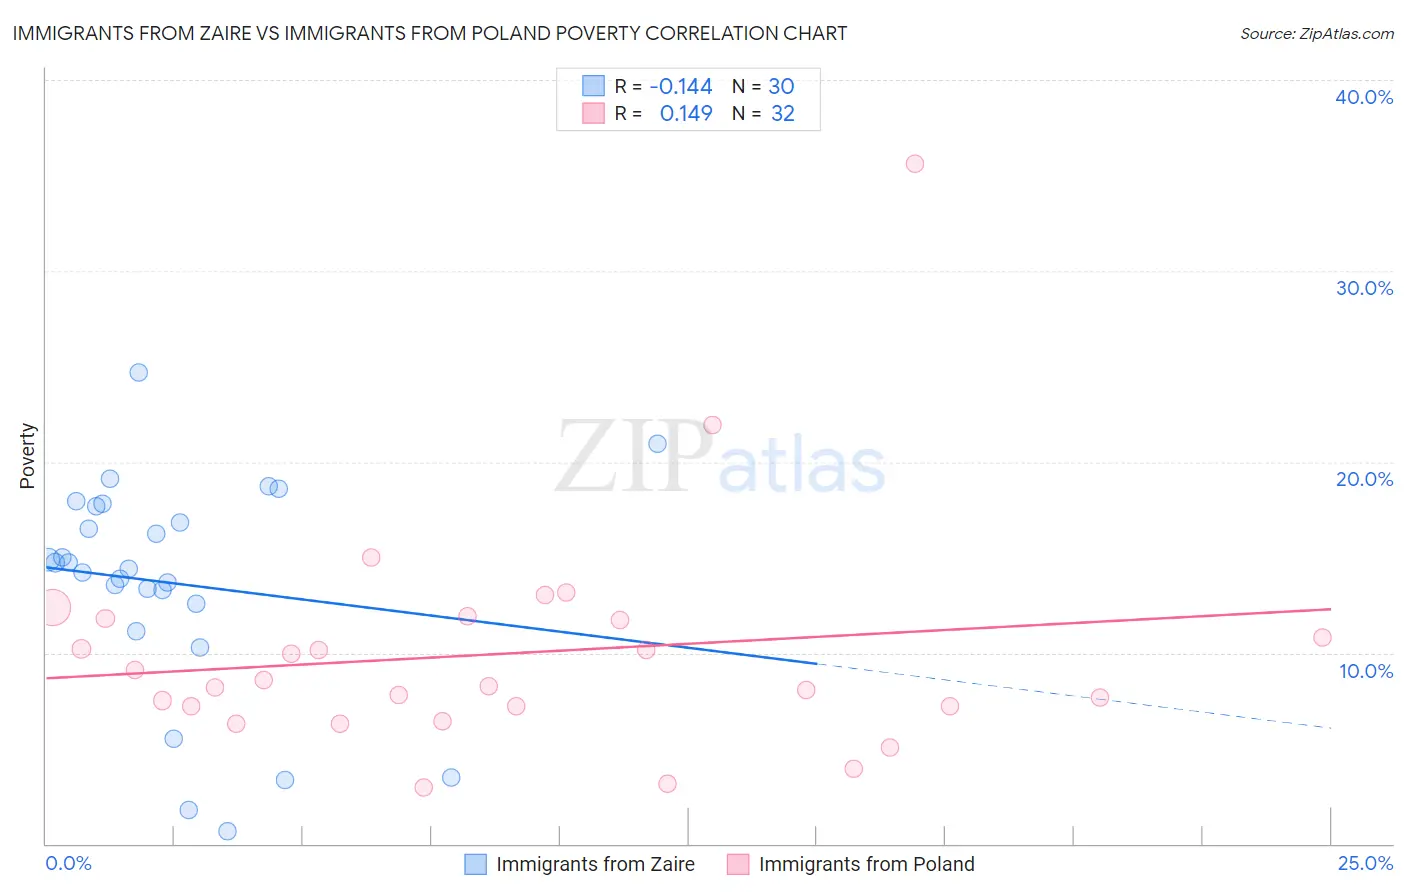
Immigrants from Zaire vs Immigrants from Poland Poverty Correlation Chart
The statistical analysis conducted on geographies consisting of 107,241,785 people shows a poor negative correlation between the proportion of Immigrants from Zaire and poverty level in the United States with a correlation coefficient (R) of -0.144 and weighted average of 15.1%. Similarly, the statistical analysis conducted on geographies consisting of 304,760,939 people shows a poor positive correlation between the proportion of Immigrants from Poland and poverty level in the United States with a correlation coefficient (R) of 0.149 and weighted average of 10.8%, a difference of 40.0%.
Poverty Correlation Summary
| Measurement | Immigrants from Zaire | Immigrants from Poland |
| Minimum | 0.62% | 2.9% |
| Maximum | 24.7% | 35.6% |
| Range | 24.1% | 32.7% |
| Mean | 13.7% | 10.0% |
| Median | 14.6% | 8.4% |
| Interquartile 25% (IQ1) | 12.6% | 7.2% |
| Interquartile 75% (IQ3) | 17.7% | 11.8% |
| Interquartile Range (IQR) | 5.1% | 4.6% |
| Standard Deviation (Sample) | 5.7% | 6.0% |
| Standard Deviation (Population) | 5.6% | 5.9% |
Similar Demographics by Poverty
Demographics Similar to Immigrants from Zaire by Poverty
In terms of poverty, the demographic groups most similar to Immigrants from Zaire are Indonesian (15.1%, a difference of 0.010%), Immigrants from Cabo Verde (15.1%, a difference of 0.060%), Mexican (15.1%, a difference of 0.18%), Immigrants from Belize (15.1%, a difference of 0.29%), and Yaqui (15.1%, a difference of 0.40%).
| Demographics | Rating | Rank | Poverty |
| Immigrants | Latin America | 0.0 /100 | #286 | Tragic 15.0% |
| Inupiat | 0.0 /100 | #287 | Tragic 15.1% |
| Yaqui | 0.0 /100 | #288 | Tragic 15.1% |
| Immigrants | Belize | 0.0 /100 | #289 | Tragic 15.1% |
| Mexicans | 0.0 /100 | #290 | Tragic 15.1% |
| Immigrants | Cabo Verde | 0.0 /100 | #291 | Tragic 15.1% |
| Indonesians | 0.0 /100 | #292 | Tragic 15.1% |
| Immigrants | Zaire | 0.0 /100 | #293 | Tragic 15.1% |
| Blackfeet | 0.0 /100 | #294 | Tragic 15.2% |
| Guatemalans | 0.0 /100 | #295 | Tragic 15.3% |
| Hispanics or Latinos | 0.0 /100 | #296 | Tragic 15.3% |
| Immigrants | Bangladesh | 0.0 /100 | #297 | Tragic 15.3% |
| Immigrants | Senegal | 0.0 /100 | #298 | Tragic 15.3% |
| Senegalese | 0.0 /100 | #299 | Tragic 15.3% |
| Immigrants | Central America | 0.0 /100 | #300 | Tragic 15.4% |
Demographics Similar to Immigrants from Poland by Poverty
In terms of poverty, the demographic groups most similar to Immigrants from Poland are Tongan (10.8%, a difference of 0.040%), Macedonian (10.8%, a difference of 0.090%), Cypriot (10.8%, a difference of 0.12%), Immigrants from Greece (10.8%, a difference of 0.22%), and Czech (10.8%, a difference of 0.26%).
| Demographics | Rating | Rank | Poverty |
| Immigrants | Northern Europe | 99.6 /100 | #27 | Exceptional 10.7% |
| Immigrants | Korea | 99.5 /100 | #28 | Exceptional 10.7% |
| Greeks | 99.5 /100 | #29 | Exceptional 10.7% |
| Danes | 99.5 /100 | #30 | Exceptional 10.7% |
| Poles | 99.5 /100 | #31 | Exceptional 10.7% |
| Iranians | 99.5 /100 | #32 | Exceptional 10.7% |
| Macedonians | 99.4 /100 | #33 | Exceptional 10.8% |
| Immigrants | Poland | 99.4 /100 | #34 | Exceptional 10.8% |
| Tongans | 99.4 /100 | #35 | Exceptional 10.8% |
| Cypriots | 99.3 /100 | #36 | Exceptional 10.8% |
| Immigrants | Greece | 99.3 /100 | #37 | Exceptional 10.8% |
| Czechs | 99.3 /100 | #38 | Exceptional 10.8% |
| Immigrants | Pakistan | 99.3 /100 | #39 | Exceptional 10.8% |
| Russians | 99.3 /100 | #40 | Exceptional 10.9% |
| Immigrants | Iran | 99.2 /100 | #41 | Exceptional 10.9% |