Immigrants from Yemen vs Immigrants from Cuba Seniors Poverty Over the Age of 75
COMPARE
Immigrants from Yemen
Immigrants from Cuba
Seniors Poverty Over the Age of 75
Seniors Poverty Over the Age of 75 Comparison
Immigrants from Yemen
Immigrants from Cuba
16.5%
SENIORS POVERTY OVER THE AGE OF 75
0.0/ 100
METRIC RATING
320th/ 347
METRIC RANK
19.9%
SENIORS POVERTY OVER THE AGE OF 75
0.0/ 100
METRIC RATING
344th/ 347
METRIC RANK
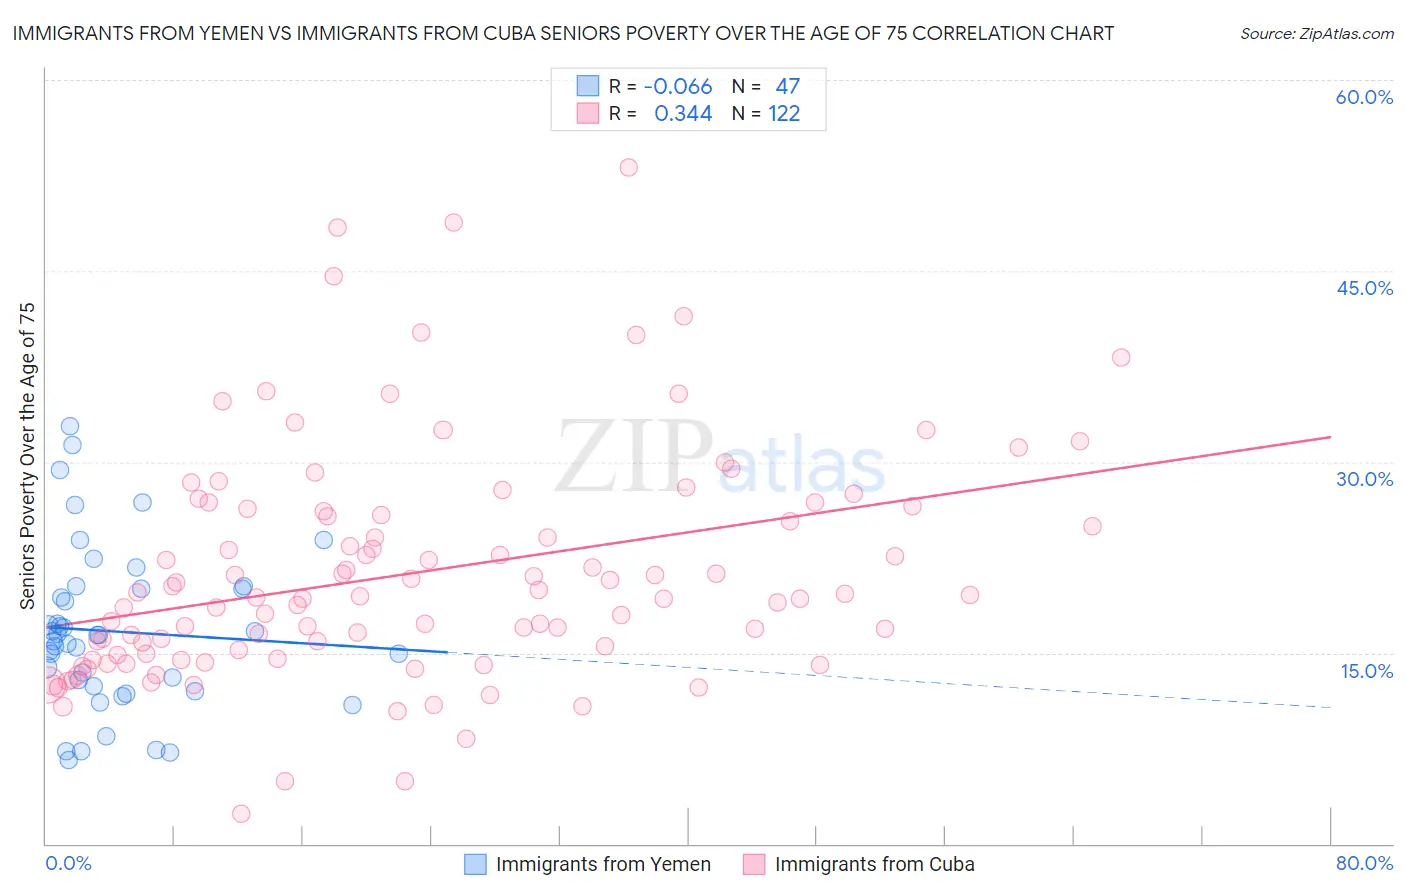
Immigrants from Yemen vs Immigrants from Cuba Seniors Poverty Over the Age of 75 Correlation Chart
The statistical analysis conducted on geographies consisting of 82,233,143 people shows a slight negative correlation between the proportion of Immigrants from Yemen and poverty level among seniors over the age of 75 in the United States with a correlation coefficient (R) of -0.066 and weighted average of 16.5%. Similarly, the statistical analysis conducted on geographies consisting of 323,529,557 people shows a mild positive correlation between the proportion of Immigrants from Cuba and poverty level among seniors over the age of 75 in the United States with a correlation coefficient (R) of 0.344 and weighted average of 19.9%, a difference of 20.7%.
Seniors Poverty Over the Age of 75 Correlation Summary
| Measurement | Immigrants from Yemen | Immigrants from Cuba |
| Minimum | 6.6% | 2.3% |
| Maximum | 32.8% | 53.2% |
| Range | 26.2% | 50.8% |
| Mean | 16.7% | 21.3% |
| Median | 16.4% | 19.4% |
| Interquartile 25% (IQ1) | 12.4% | 14.8% |
| Interquartile 75% (IQ3) | 20.0% | 26.1% |
| Interquartile Range (IQR) | 7.6% | 11.3% |
| Standard Deviation (Sample) | 6.3% | 9.1% |
| Standard Deviation (Population) | 6.2% | 9.1% |
Similar Demographics by Seniors Poverty Over the Age of 75
Demographics Similar to Immigrants from Yemen by Seniors Poverty Over the Age of 75
In terms of seniors poverty over the age of 75, the demographic groups most similar to Immigrants from Yemen are Immigrants from Haiti (16.5%, a difference of 0.18%), Immigrants from Barbados (16.5%, a difference of 0.21%), Central American Indian (16.5%, a difference of 0.30%), Immigrants from Uzbekistan (16.5%, a difference of 0.35%), and Nicaraguan (16.6%, a difference of 0.73%).
| Demographics | Rating | Rank | Seniors Poverty Over the Age of 75 |
| Barbadians | 0.0 /100 | #313 | Tragic 16.0% |
| Tsimshian | 0.0 /100 | #314 | Tragic 16.1% |
| Guyanese | 0.0 /100 | #315 | Tragic 16.1% |
| Immigrants | Ecuador | 0.0 /100 | #316 | Tragic 16.1% |
| Immigrants | Guyana | 0.0 /100 | #317 | Tragic 16.2% |
| Houma | 0.0 /100 | #318 | Tragic 16.2% |
| Haitians | 0.0 /100 | #319 | Tragic 16.2% |
| Immigrants | Yemen | 0.0 /100 | #320 | Tragic 16.5% |
| Immigrants | Haiti | 0.0 /100 | #321 | Tragic 16.5% |
| Immigrants | Barbados | 0.0 /100 | #322 | Tragic 16.5% |
| Central American Indians | 0.0 /100 | #323 | Tragic 16.5% |
| Immigrants | Uzbekistan | 0.0 /100 | #324 | Tragic 16.5% |
| Nicaraguans | 0.0 /100 | #325 | Tragic 16.6% |
| Pueblo | 0.0 /100 | #326 | Tragic 16.7% |
| Sioux | 0.0 /100 | #327 | Tragic 16.8% |
Demographics Similar to Immigrants from Cuba by Seniors Poverty Over the Age of 75
In terms of seniors poverty over the age of 75, the demographic groups most similar to Immigrants from Cuba are Immigrants from Dominican Republic (20.1%, a difference of 0.78%), Lumbee (19.7%, a difference of 0.79%), Dominican (19.6%, a difference of 1.5%), Navajo (19.4%, a difference of 2.7%), and Tohono O'odham (19.1%, a difference of 4.0%).
| Demographics | Rating | Rank | Seniors Poverty Over the Age of 75 |
| Immigrants | Nicaragua | 0.0 /100 | #333 | Tragic 17.6% |
| Immigrants | Grenada | 0.0 /100 | #334 | Tragic 17.8% |
| Cubans | 0.0 /100 | #335 | Tragic 18.0% |
| Immigrants | Caribbean | 0.0 /100 | #336 | Tragic 18.2% |
| Yakama | 0.0 /100 | #337 | Tragic 18.3% |
| Immigrants | Cabo Verde | 0.0 /100 | #338 | Tragic 18.5% |
| Hopi | 0.0 /100 | #339 | Tragic 18.9% |
| Tohono O'odham | 0.0 /100 | #340 | Tragic 19.1% |
| Navajo | 0.0 /100 | #341 | Tragic 19.4% |
| Dominicans | 0.0 /100 | #342 | Tragic 19.6% |
| Lumbee | 0.0 /100 | #343 | Tragic 19.7% |
| Immigrants | Cuba | 0.0 /100 | #344 | Tragic 19.9% |
| Immigrants | Dominican Republic | 0.0 /100 | #345 | Tragic 20.1% |
| Puerto Ricans | 0.0 /100 | #346 | Tragic 23.2% |
| Pima | 0.0 /100 | #347 | Tragic 23.9% |