Immigrants from Western Europe vs Immigrants from Russia Disability Age 5 to 17
COMPARE
Immigrants from Western Europe
Immigrants from Russia
Disability Age 5 to 17
Disability Age 5 to 17 Comparison
Immigrants from Western Europe
Immigrants from Russia
5.6%
DISABILITY AGE 5 TO 17
47.8/ 100
METRIC RATING
177th/ 347
METRIC RANK
5.0%
DISABILITY AGE 5 TO 17
100.0/ 100
METRIC RATING
43rd/ 347
METRIC RANK
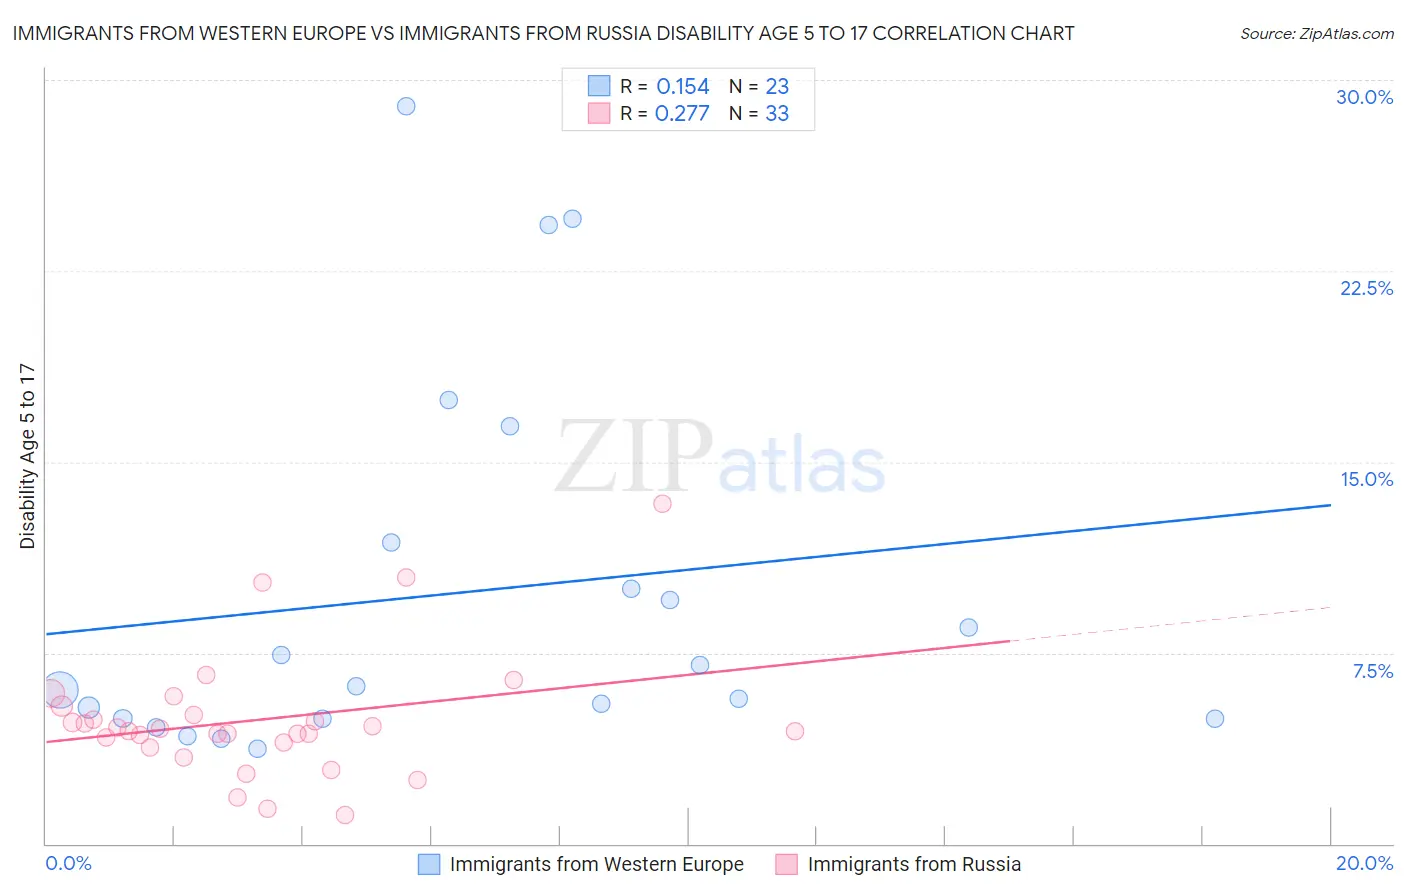
Immigrants from Western Europe vs Immigrants from Russia Disability Age 5 to 17 Correlation Chart
The statistical analysis conducted on geographies consisting of 487,296,629 people shows a poor positive correlation between the proportion of Immigrants from Western Europe and percentage of population with a disability between the ages 5 and 17 in the United States with a correlation coefficient (R) of 0.154 and weighted average of 5.6%. Similarly, the statistical analysis conducted on geographies consisting of 345,279,670 people shows a weak positive correlation between the proportion of Immigrants from Russia and percentage of population with a disability between the ages 5 and 17 in the United States with a correlation coefficient (R) of 0.277 and weighted average of 5.0%, a difference of 11.3%.
Disability Age 5 to 17 Correlation Summary
| Measurement | Immigrants from Western Europe | Immigrants from Russia |
| Minimum | 3.7% | 1.1% |
| Maximum | 29.0% | 13.3% |
| Range | 25.2% | 12.2% |
| Mean | 9.8% | 4.9% |
| Median | 6.2% | 4.4% |
| Interquartile 25% (IQ1) | 4.9% | 3.9% |
| Interquartile 75% (IQ3) | 11.8% | 5.2% |
| Interquartile Range (IQR) | 6.9% | 1.4% |
| Standard Deviation (Sample) | 7.4% | 2.5% |
| Standard Deviation (Population) | 7.2% | 2.4% |
Similar Demographics by Disability Age 5 to 17
Demographics Similar to Immigrants from Western Europe by Disability Age 5 to 17
In terms of disability age 5 to 17, the demographic groups most similar to Immigrants from Western Europe are Immigrants from Trinidad and Tobago (5.6%, a difference of 0.010%), Shoshone (5.6%, a difference of 0.080%), Immigrants from Central America (5.6%, a difference of 0.080%), Costa Rican (5.6%, a difference of 0.11%), and Uruguayan (5.6%, a difference of 0.16%).
| Demographics | Rating | Rank | Disability Age 5 to 17 |
| Serbians | 54.0 /100 | #170 | Average 5.6% |
| Immigrants | Iraq | 53.9 /100 | #171 | Average 5.6% |
| Ukrainians | 51.5 /100 | #172 | Average 5.6% |
| Uruguayans | 51.0 /100 | #173 | Average 5.6% |
| Costa Ricans | 50.0 /100 | #174 | Average 5.6% |
| Shoshone | 49.4 /100 | #175 | Average 5.6% |
| Immigrants | Central America | 49.4 /100 | #176 | Average 5.6% |
| Immigrants | Western Europe | 47.8 /100 | #177 | Average 5.6% |
| Immigrants | Trinidad and Tobago | 47.6 /100 | #178 | Average 5.6% |
| Immigrants | Barbados | 40.5 /100 | #179 | Average 5.6% |
| Immigrants | Uruguay | 37.7 /100 | #180 | Fair 5.6% |
| Immigrants | England | 36.4 /100 | #181 | Fair 5.6% |
| Mexican American Indians | 35.2 /100 | #182 | Fair 5.6% |
| Immigrants | Latin America | 34.3 /100 | #183 | Fair 5.6% |
| Syrians | 33.8 /100 | #184 | Fair 5.6% |
Demographics Similar to Immigrants from Russia by Disability Age 5 to 17
In terms of disability age 5 to 17, the demographic groups most similar to Immigrants from Russia are Egyptian (5.0%, a difference of 0.040%), Tongan (5.0%, a difference of 0.11%), Assyrian/Chaldean/Syriac (5.0%, a difference of 0.18%), Vietnamese (5.1%, a difference of 0.30%), and Immigrants from Sri Lanka (5.0%, a difference of 0.38%).
| Demographics | Rating | Rank | Disability Age 5 to 17 |
| Immigrants | Egypt | 100.0 /100 | #36 | Exceptional 5.0% |
| Immigrants | Belarus | 100.0 /100 | #37 | Exceptional 5.0% |
| Immigrants | Philippines | 100.0 /100 | #38 | Exceptional 5.0% |
| Immigrants | Argentina | 100.0 /100 | #39 | Exceptional 5.0% |
| Okinawans | 100.0 /100 | #40 | Exceptional 5.0% |
| Immigrants | Australia | 100.0 /100 | #41 | Exceptional 5.0% |
| Immigrants | Sri Lanka | 100.0 /100 | #42 | Exceptional 5.0% |
| Immigrants | Russia | 100.0 /100 | #43 | Exceptional 5.0% |
| Egyptians | 100.0 /100 | #44 | Exceptional 5.0% |
| Tongans | 100.0 /100 | #45 | Exceptional 5.0% |
| Assyrians/Chaldeans/Syriacs | 100.0 /100 | #46 | Exceptional 5.0% |
| Vietnamese | 100.0 /100 | #47 | Exceptional 5.1% |
| Koreans | 100.0 /100 | #48 | Exceptional 5.1% |
| Immigrants | Western Asia | 100.0 /100 | #49 | Exceptional 5.1% |
| Argentineans | 99.9 /100 | #50 | Exceptional 5.1% |