Immigrants from West Indies vs Immigrants Unemployment Among Ages 55 to 59 years
COMPARE
Immigrants from West Indies
Immigrants
Unemployment Among Ages 55 to 59 years
Unemployment Among Ages 55 to 59 years Comparison
Immigrants from West Indies
Immigrants
5.1%
UNEMPLOYMENT AMONG AGES 55 TO 59 YEARS
0.2/ 100
METRIC RATING
259th/ 347
METRIC RANK
5.0%
UNEMPLOYMENT AMONG AGES 55 TO 59 YEARS
2.3/ 100
METRIC RATING
233rd/ 347
METRIC RANK
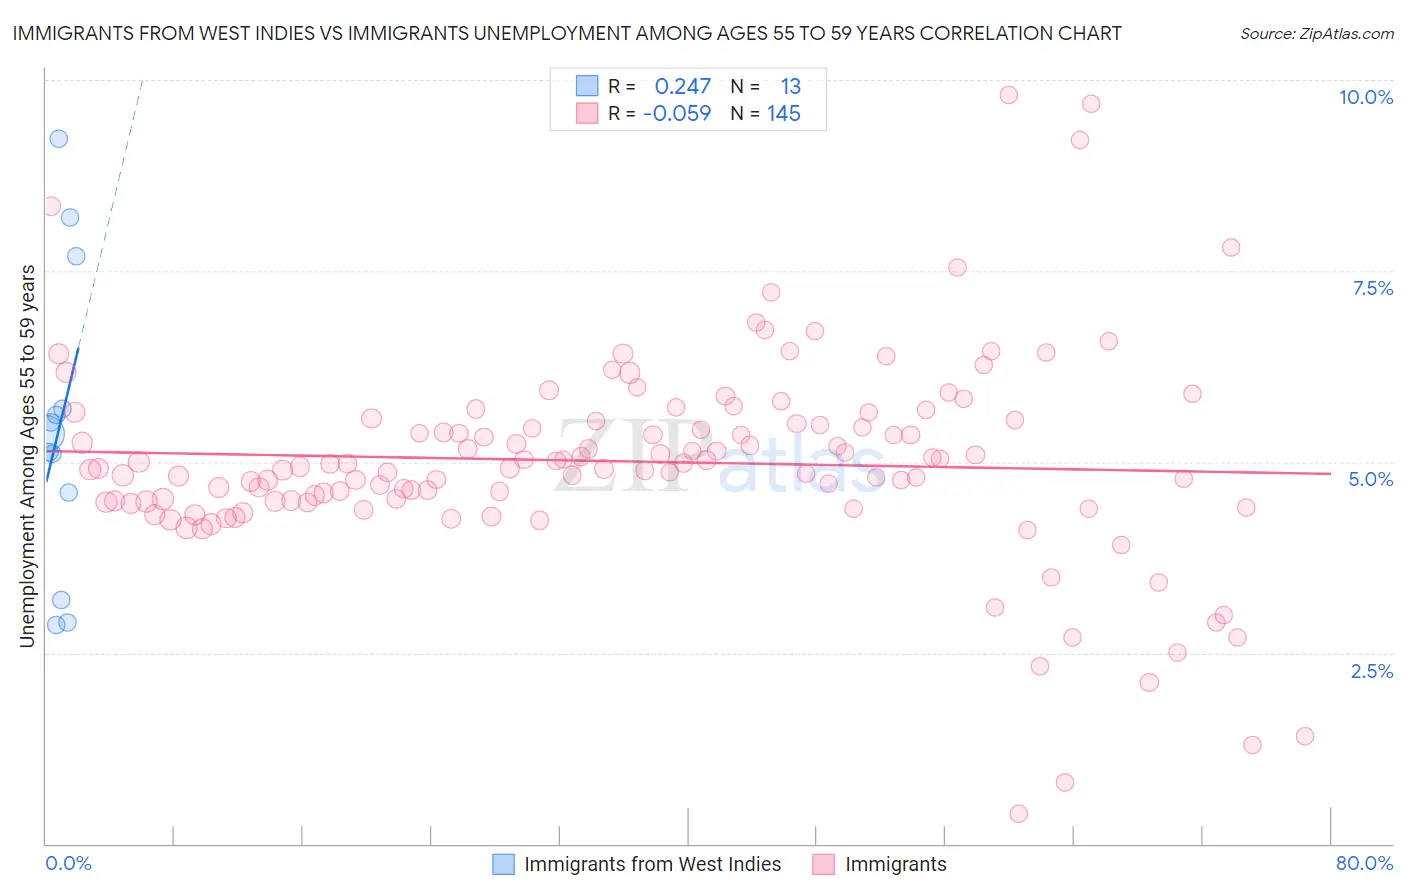
Immigrants from West Indies vs Immigrants Unemployment Among Ages 55 to 59 years Correlation Chart
The statistical analysis conducted on geographies consisting of 71,668,228 people shows a weak positive correlation between the proportion of Immigrants from West Indies and unemployment rate among population between the ages 55 and 59 in the United States with a correlation coefficient (R) of 0.247 and weighted average of 5.1%. Similarly, the statistical analysis conducted on geographies consisting of 491,076,456 people shows a slight negative correlation between the proportion of Immigrants and unemployment rate among population between the ages 55 and 59 in the United States with a correlation coefficient (R) of -0.059 and weighted average of 5.0%, a difference of 2.5%.
Unemployment Among Ages 55 to 59 years Correlation Summary
| Measurement | Immigrants from West Indies | Immigrants |
| Minimum | 2.9% | 0.40% |
| Maximum | 9.2% | 9.8% |
| Range | 6.4% | 9.4% |
| Mean | 5.5% | 5.0% |
| Median | 5.4% | 4.9% |
| Interquartile 25% (IQ1) | 3.9% | 4.5% |
| Interquartile 75% (IQ3) | 6.7% | 5.5% |
| Interquartile Range (IQR) | 2.8% | 1.1% |
| Standard Deviation (Sample) | 2.0% | 1.4% |
| Standard Deviation (Population) | 1.9% | 1.3% |
Similar Demographics by Unemployment Among Ages 55 to 59 years
Demographics Similar to Immigrants from West Indies by Unemployment Among Ages 55 to 59 years
In terms of unemployment among ages 55 to 59 years, the demographic groups most similar to Immigrants from West Indies are Salvadoran (5.1%, a difference of 0.090%), Central American (5.1%, a difference of 0.10%), Immigrants from Western Africa (5.1%, a difference of 0.10%), African (5.1%, a difference of 0.21%), and Immigrants from El Salvador (5.1%, a difference of 0.28%).
| Demographics | Rating | Rank | Unemployment Among Ages 55 to 59 years |
| U.S. Virgin Islanders | 0.3 /100 | #252 | Tragic 5.1% |
| Paraguayans | 0.3 /100 | #253 | Tragic 5.1% |
| Seminole | 0.3 /100 | #254 | Tragic 5.1% |
| Blackfeet | 0.3 /100 | #255 | Tragic 5.1% |
| Senegalese | 0.3 /100 | #256 | Tragic 5.1% |
| Central Americans | 0.2 /100 | #257 | Tragic 5.1% |
| Salvadorans | 0.2 /100 | #258 | Tragic 5.1% |
| Immigrants | West Indies | 0.2 /100 | #259 | Tragic 5.1% |
| Immigrants | Western Africa | 0.2 /100 | #260 | Tragic 5.1% |
| Africans | 0.1 /100 | #261 | Tragic 5.1% |
| Immigrants | El Salvador | 0.1 /100 | #262 | Tragic 5.1% |
| Immigrants | Sierra Leone | 0.1 /100 | #263 | Tragic 5.2% |
| Immigrants | Caribbean | 0.1 /100 | #264 | Tragic 5.2% |
| Yaqui | 0.1 /100 | #265 | Tragic 5.2% |
| Jamaicans | 0.1 /100 | #266 | Tragic 5.2% |
Demographics Similar to Immigrants by Unemployment Among Ages 55 to 59 years
In terms of unemployment among ages 55 to 59 years, the demographic groups most similar to Immigrants are Albanian (5.0%, a difference of 0.080%), Cherokee (5.0%, a difference of 0.14%), Immigrants from Syria (5.0%, a difference of 0.17%), Immigrants from Southern Europe (5.0%, a difference of 0.24%), and Immigrants from Western Asia (5.0%, a difference of 0.27%).
| Demographics | Rating | Rank | Unemployment Among Ages 55 to 59 years |
| Immigrants | China | 4.2 /100 | #226 | Tragic 5.0% |
| Immigrants | Iran | 3.7 /100 | #227 | Tragic 5.0% |
| Immigrants | Liberia | 3.2 /100 | #228 | Tragic 5.0% |
| Immigrants | Western Asia | 3.0 /100 | #229 | Tragic 5.0% |
| Immigrants | Syria | 2.7 /100 | #230 | Tragic 5.0% |
| Cherokee | 2.6 /100 | #231 | Tragic 5.0% |
| Albanians | 2.5 /100 | #232 | Tragic 5.0% |
| Immigrants | Immigrants | 2.3 /100 | #233 | Tragic 5.0% |
| Immigrants | Southern Europe | 1.8 /100 | #234 | Tragic 5.0% |
| Immigrants | Hong Kong | 1.4 /100 | #235 | Tragic 5.0% |
| Immigrants | Albania | 1.3 /100 | #236 | Tragic 5.0% |
| Choctaw | 1.3 /100 | #237 | Tragic 5.0% |
| Moroccans | 1.3 /100 | #238 | Tragic 5.0% |
| French American Indians | 1.2 /100 | #239 | Tragic 5.0% |
| Immigrants | Costa Rica | 1.1 /100 | #240 | Tragic 5.0% |