Immigrants from Uruguay vs Immigrants from Western Europe Hearing Disability

COMPARE

Immigrants from Uruguay
Race
Ancestry
AfghanAfricanAlaska NativeAlaskan AthabascanAlbanianAleutAlsatianAmericanApacheArabArapahoArgentineanArmenianAssyrian/Chaldean/SyriacAustralianAustrianBahamianBangladeshiBarbadianBasqueBelgianBelizeanBermudanBhutaneseBlackfeetBolivianBrazilianBritishBritish West IndianBulgarianBurmeseCajunCambodianCanadianCape VerdeanCarpatho RusynCelticCentral AmericanCentral American IndianCherokeeCheyenneChickasawChileanChineseChippewaChoctawColombianColvilleComancheCosta RicanCreeCreekCroatianCrowCubanCypriotCzechCzechoslovakianDanishDelawareDominicanDutchDutch West IndianEastern EuropeanEcuadorianEgyptianEnglishEstonianEthiopianEuropeanFijianFilipinoFinnishFrenchFrench American IndianFrench CanadianGermanGerman RussianGhanaianGreekGuamanian/ChamorroGuatemalanGuyaneseHaitianHmongHonduranHopiHoumaHungarianIcelanderIndian (Asian)IndonesianInupiatIranianIraqiIrishIroquoisIsraeliItalianJamaicanJapaneseJordanianKenyanKiowaKoreanLaotianLatvianLebaneseLiberianLithuanianLumbeeLuxembourgerMacedonianMalaysianMalteseMarshalleseMenomineeMexicanMexican American IndianMongolianMoroccanNative HawaiianNavajoNepaleseNew ZealanderNicaraguanNigerianNorthern EuropeanNorwegianOkinawanOsageOttawaPaiutePakistaniPalestinianPanamanianParaguayanPennsylvania GermanPeruvianPimaPolishPortuguesePotawatomiPuebloPuerto RicanPuget Sound SalishRomanianRussianSalvadoranSamoanScandinavianScotch-IrishScottishSeminoleSenegaleseSerbianShoshoneSierra LeoneanSiouxSlavicSlovakSloveneSomaliSouth AfricanSouth AmericanSouth American IndianSoviet UnionSpaniardSpanishSpanish AmericanSpanish American IndianSri LankanSubsaharan AfricanSudaneseSwedishSwissSyrianTaiwaneseThaiTlingit-HaidaTohono O'OdhamTonganTrinidadian and TobagonianTsimshianTurkishU.S. Virgin IslanderUgandanUkrainianUruguayanUteVenezuelanVietnameseWelshWest IndianYakamaYaquiYugoslavianYumanYup'ikZimbabwean
Immigration
NonimmigrantsImmigrantsAfghanistanAfricaAlbaniaArgentinaArmeniaAsiaAustraliaAustriaBahamasBangladeshBarbadosBelarusBelgiumBelizeBoliviaBosnia and HerzegovinaBrazilBulgariaBurma/MyanmarCabo VerdeCambodiaCameroonCanadaCaribbeanCentral AmericaChileChinaColombiaCongoCosta RicaCroatiaCubaCzechoslovakiaDenmarkDominicaDominican RepublicEastern AfricaEastern AsiaEastern EuropeEcuadorEgyptEl SalvadorEnglandEritreaEthiopiaEuropeFijiFranceGermanyGhanaGreeceGrenadaGuatemalaGuyanaHaitiHondurasHong KongHungaryIndiaIndonesiaIranIraqIrelandIsraelItalyJamaicaJapanJordanKazakhstanKenyaKoreaKuwaitLaosLatin AmericaLatviaLebanonLiberiaLithuaniaMalaysiaMexicoMicronesiaMiddle AfricaMoldovaMoroccoNepalNetherlandsNicaraguaNigeriaNorth AmericaNorth MacedoniaNorthern AfricaNorthern EuropeNorwayOceaniaPakistanPanamaPeruPhilippinesPolandPortugalRomaniaRussiaSaudi ArabiaScotlandSenegalSerbiaSierra LeoneSingaporeSomaliaSouth AfricaSouth AmericaSouth Central AsiaSouth Eastern AsiaSouthern EuropeSpainSri LankaSt. Vincent and the GrenadinesSudanSwedenSwitzerlandSyriaTaiwanThailandTrinidad and TobagoTurkeyUgandaUkraineUruguayUzbekistanVenezuelaVietnamWest IndiesWestern AfricaWestern AsiaYemenZaireZimbabweAzores
Immigrants from Western Europe
Race
Ancestry
AfghanAfricanAlaska NativeAlaskan AthabascanAlbanianAleutAlsatianAmericanApacheArabArapahoArgentineanArmenianAssyrian/Chaldean/SyriacAustralianAustrianBahamianBangladeshiBarbadianBasqueBelgianBelizeanBermudanBhutaneseBlackfeetBolivianBrazilianBritishBritish West IndianBulgarianBurmeseCajunCambodianCanadianCape VerdeanCarpatho RusynCelticCentral AmericanCentral American IndianCherokeeCheyenneChickasawChileanChineseChippewaChoctawColombianColvilleComancheCosta RicanCreeCreekCroatianCrowCubanCypriotCzechCzechoslovakianDanishDelawareDominicanDutchDutch West IndianEastern EuropeanEcuadorianEgyptianEnglishEstonianEthiopianEuropeanFijianFilipinoFinnishFrenchFrench American IndianFrench CanadianGermanGerman RussianGhanaianGreekGuamanian/ChamorroGuatemalanGuyaneseHaitianHmongHonduranHopiHoumaHungarianIcelanderIndian (Asian)IndonesianInupiatIranianIraqiIrishIroquoisIsraeliItalianJamaicanJapaneseJordanianKenyanKiowaKoreanLaotianLatvianLebaneseLiberianLithuanianLumbeeLuxembourgerMacedonianMalaysianMalteseMarshalleseMenomineeMexicanMexican American IndianMongolianMoroccanNative HawaiianNavajoNepaleseNew ZealanderNicaraguanNigerianNorthern EuropeanNorwegianOkinawanOsageOttawaPaiutePakistaniPalestinianPanamanianParaguayanPennsylvania GermanPeruvianPimaPolishPortuguesePotawatomiPuebloPuerto RicanPuget Sound SalishRomanianRussianSalvadoranSamoanScandinavianScotch-IrishScottishSeminoleSenegaleseSerbianShoshoneSierra LeoneanSiouxSlavicSlovakSloveneSomaliSouth AfricanSouth AmericanSouth American IndianSoviet UnionSpaniardSpanishSpanish AmericanSpanish American IndianSri LankanSubsaharan AfricanSudaneseSwedishSwissSyrianTaiwaneseThaiTlingit-HaidaTohono O'OdhamTonganTrinidadian and TobagonianTsimshianTurkishU.S. Virgin IslanderUgandanUkrainianUruguayanUteVenezuelanVietnameseWelshWest IndianYakamaYaquiYugoslavianYumanYup'ikZimbabwean
Immigration
NonimmigrantsImmigrantsAfghanistanAfricaAlbaniaArgentinaArmeniaAsiaAustraliaAustriaBahamasBangladeshBarbadosBelarusBelgiumBelizeBoliviaBosnia and HerzegovinaBrazilBulgariaBurma/MyanmarCabo VerdeCambodiaCameroonCanadaCaribbeanCentral AmericaChileChinaColombiaCongoCosta RicaCroatiaCubaCzechoslovakiaDenmarkDominicaDominican RepublicEastern AfricaEastern AsiaEastern EuropeEcuadorEgyptEl SalvadorEnglandEritreaEthiopiaEuropeFijiFranceGermanyGhanaGreeceGrenadaGuatemalaGuyanaHaitiHondurasHong KongHungaryIndiaIndonesiaIranIraqIrelandIsraelItalyJamaicaJapanJordanKazakhstanKenyaKoreaKuwaitLaosLatin AmericaLatviaLebanonLiberiaLithuaniaMalaysiaMexicoMicronesiaMiddle AfricaMoldovaMoroccoNepalNetherlandsNicaraguaNigeriaNorth AmericaNorth MacedoniaNorthern AfricaNorthern EuropeNorwayOceaniaPakistanPanamaPeruPhilippinesPolandPortugalRomaniaRussiaSaudi ArabiaScotlandSenegalSerbiaSierra LeoneSingaporeSomaliaSouth AfricaSouth AmericaSouth Central AsiaSouth Eastern AsiaSouthern EuropeSpainSri LankaSt. Vincent and the GrenadinesSudanSwedenSwitzerlandSyriaTaiwanThailandTrinidad and TobagoTurkeyUgandaUkraineUzbekistanVenezuelaVietnamWest IndiesWestern AfricaWestern AsiaWestern EuropeYemenZaireZimbabweAzores
Hearing Disability
Income
Poverty
Unemployment
Labor Participation
Family Structure
Vehicle Availability
Education Level
Disability

Hearing Disability Comparison

Immigrants from Uruguay

Immigrants from Western Europe

Exceptional
Tragic
2.7%
HEARING DISABILITY
97.2/ 100
METRIC RATING
81st/ 347
METRIC RANK
3.3%
HEARING DISABILITY
1.0/ 100
METRIC RATING
243rd/ 347
METRIC RANK

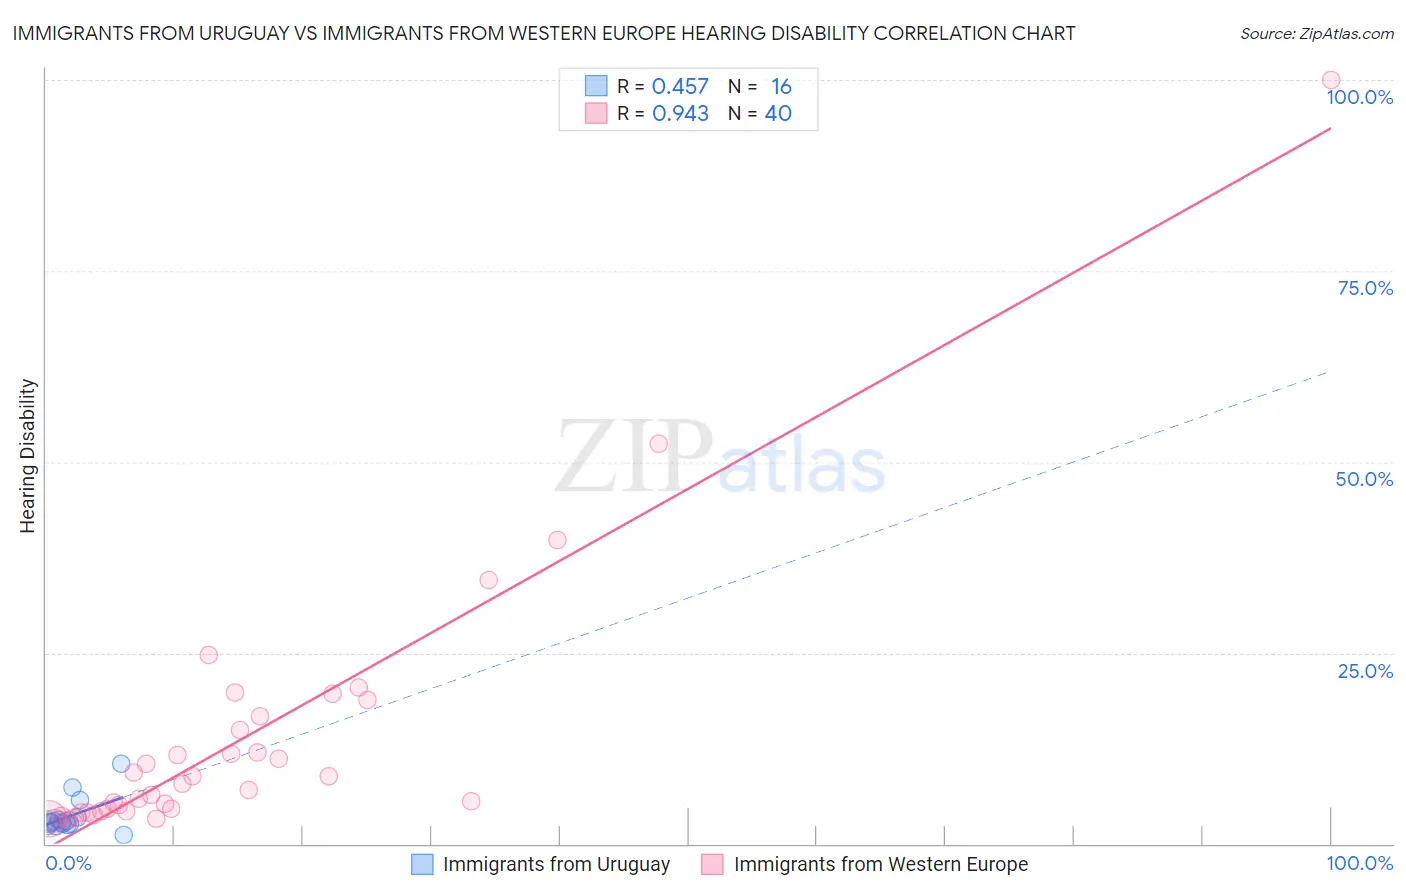
Immigrants from Uruguay vs Immigrants from Western Europe Hearing Disability Correlation Chart

The statistical analysis conducted on geographies consisting of 133,251,950 people shows a moderate positive correlation between the proportion of Immigrants from Uruguay and percentage of population with hearing disability in the United States with a correlation coefficient (R) of 0.457 and weighted average of 2.7%. Similarly, the statistical analysis conducted on geographies consisting of 493,839,784 people shows a near-perfect positive correlation between the proportion of Immigrants from Western Europe and percentage of population with hearing disability in the United States with a correlation coefficient (R) of 0.943 and weighted average of 3.3%, a difference of 21.0%.
Immigrants from Uruguay vs Immigrants from Western Europe Hearing Disability

Hearing Disability Correlation Summary

MeasurementImmigrants from UruguayImmigrants from Western Europe
Minimum1.2%3.1%
Maximum10.4%100.0%
Range9.2%96.9%
Mean3.6%13.6%
Median2.8%7.5%
Interquartile 25% (IQ1)2.6%4.3%
Interquartile 75% (IQ3)3.2%15.8%
Interquartile Range (IQR)0.58%11.5%
Standard Deviation (Sample)2.3%17.7%
Standard Deviation (Population)2.2%17.4%

Similar Demographics by Hearing Disability

Demographics Similar to Immigrants from Uruguay by Hearing Disability

In terms of hearing disability, the demographic groups most similar to Immigrants from Uruguay are Immigrants from Armenia (2.7%, a difference of 0.020%), Immigrants from Asia (2.7%, a difference of 0.030%), Immigrants from Cuba (2.7%, a difference of 0.030%), Colombian (2.7%, a difference of 0.21%), and Mongolian (2.7%, a difference of 0.23%).
DemographicsRating | RankHearing Disability
Immigrants | Korea
97.5
/100
|
#74
Exceptional
2.7%
Immigrants | Saudi Arabia
97.5
/100
|
#75
Exceptional
2.7%
Asians
97.5
/100
|
#76
Exceptional
2.7%
Immigrants | Malaysia
97.5
/100
|
#77
Exceptional
2.7%
Mongolians
97.4
/100
|
#78
Exceptional
2.7%
Colombians
97.4
/100
|
#79
Exceptional
2.7%
Immigrants | Asia
97.2
/100
|
#80
Exceptional
2.7%
Immigrants | Uruguay
97.2
/100
|
#81
Exceptional
2.7%
Immigrants | Armenia
97.2
/100
|
#82
Exceptional
2.7%
Immigrants | Cuba
97.2
/100
|
#83
Exceptional
2.7%
Immigrants | Argentina
97.0
/100
|
#84
Exceptional
2.8%
Immigrants | Northern Africa
96.9
/100
|
#85
Exceptional
2.8%
Immigrants | Iran
96.8
/100
|
#86
Exceptional
2.8%
Somalis
96.7
/100
|
#87
Exceptional
2.8%
Immigrants | Turkey
96.7
/100
|
#88
Exceptional
2.8%

Demographics Similar to Immigrants from Western Europe by Hearing Disability

In terms of hearing disability, the demographic groups most similar to Immigrants from Western Europe are Assyrian/Chaldean/Syriac (3.3%, a difference of 0.070%), Yugoslavian (3.3%, a difference of 0.17%), Samoan (3.3%, a difference of 0.28%), Immigrants from Netherlands (3.3%, a difference of 0.35%), and Immigrants from Scotland (3.3%, a difference of 0.41%).
DemographicsRating | RankHearing Disability
Serbians
2.2
/100
|
#236
Tragic
3.3%
Immigrants | Austria
1.8
/100
|
#237
Tragic
3.3%
German Russians
1.8
/100
|
#238
Tragic
3.3%
Nepalese
1.2
/100
|
#239
Tragic
3.3%
Immigrants | Netherlands
1.1
/100
|
#240
Tragic
3.3%
Samoans
1.1
/100
|
#241
Tragic
3.3%
Yugoslavians
1.0
/100
|
#242
Tragic
3.3%
Immigrants | Western Europe
1.0
/100
|
#243
Tragic
3.3%
Assyrians/Chaldeans/Syriacs
0.9
/100
|
#244
Tragic
3.3%
Immigrants | Scotland
0.8
/100
|
#245
Tragic
3.3%
Immigrants | England
0.7
/100
|
#246
Tragic
3.3%
Lithuanians
0.6
/100
|
#247
Tragic
3.4%
Austrians
0.6
/100
|
#248
Tragic
3.4%
Italians
0.4
/100
|
#249
Tragic
3.4%
Yuman
0.4
/100
|
#250
Tragic
3.4%