Immigrants from Uganda vs Laotian Single Father Households
COMPARE
Immigrants from Uganda
Laotian
Single Father Households
Single Father Households Comparison
Immigrants from Uganda
Laotians
2.4%
SINGLE FATHER HOUSEHOLDS
26.0/ 100
METRIC RATING
201st/ 347
METRIC RANK
2.2%
SINGLE FATHER HOUSEHOLDS
92.5/ 100
METRIC RATING
141st/ 347
METRIC RANK
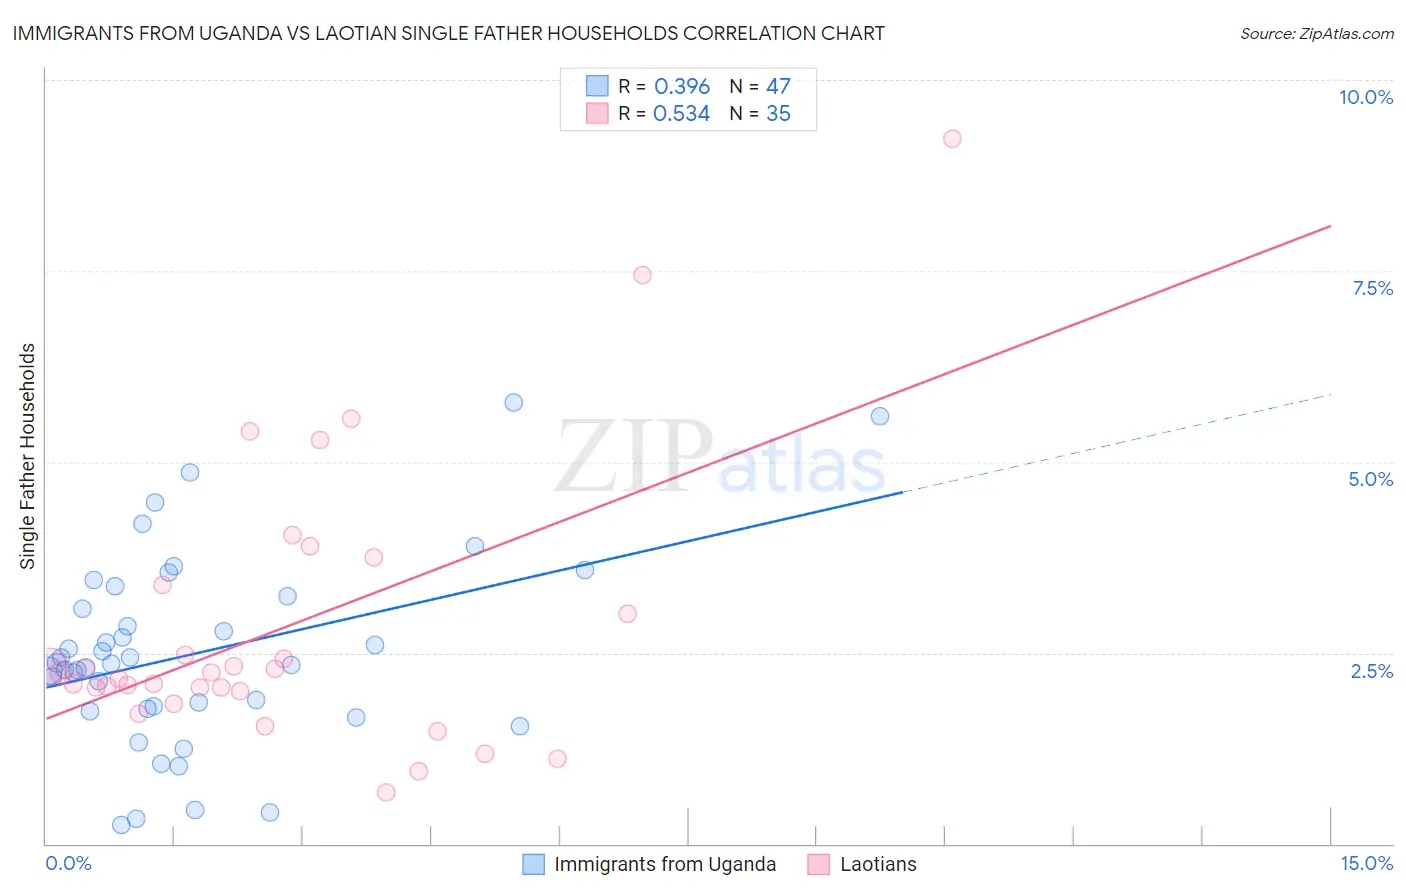
Immigrants from Uganda vs Laotian Single Father Households Correlation Chart
The statistical analysis conducted on geographies consisting of 125,685,639 people shows a mild positive correlation between the proportion of Immigrants from Uganda and percentage of single father households in the United States with a correlation coefficient (R) of 0.396 and weighted average of 2.4%. Similarly, the statistical analysis conducted on geographies consisting of 223,877,457 people shows a substantial positive correlation between the proportion of Laotians and percentage of single father households in the United States with a correlation coefficient (R) of 0.534 and weighted average of 2.2%, a difference of 6.8%.
Single Father Households Correlation Summary
| Measurement | Immigrants from Uganda | Laotian |
| Minimum | 0.24% | 0.67% |
| Maximum | 5.8% | 9.2% |
| Range | 5.5% | 8.6% |
| Mean | 2.5% | 2.8% |
| Median | 2.4% | 2.2% |
| Interquartile 25% (IQ1) | 1.8% | 2.0% |
| Interquartile 75% (IQ3) | 3.2% | 3.4% |
| Interquartile Range (IQR) | 1.5% | 1.4% |
| Standard Deviation (Sample) | 1.2% | 1.8% |
| Standard Deviation (Population) | 1.2% | 1.8% |
Similar Demographics by Single Father Households
Demographics Similar to Immigrants from Uganda by Single Father Households
In terms of single father households, the demographic groups most similar to Immigrants from Uganda are German Russian (2.4%, a difference of 0.030%), Immigrants from Vietnam (2.4%, a difference of 0.10%), Peruvian (2.4%, a difference of 0.10%), Scandinavian (2.4%, a difference of 0.13%), and French Canadian (2.4%, a difference of 0.13%).
| Demographics | Rating | Rank | Single Father Households |
| Panamanians | 29.6 /100 | #194 | Fair 2.4% |
| Immigrants | Philippines | 28.7 /100 | #195 | Fair 2.4% |
| Kenyans | 28.0 /100 | #196 | Fair 2.4% |
| Germans | 28.0 /100 | #197 | Fair 2.4% |
| Scandinavians | 27.4 /100 | #198 | Fair 2.4% |
| Immigrants | Vietnam | 27.1 /100 | #199 | Fair 2.4% |
| Peruvians | 27.1 /100 | #200 | Fair 2.4% |
| Immigrants | Uganda | 26.0 /100 | #201 | Fair 2.4% |
| German Russians | 25.7 /100 | #202 | Fair 2.4% |
| French Canadians | 24.7 /100 | #203 | Fair 2.4% |
| Ecuadorians | 24.5 /100 | #204 | Fair 2.4% |
| Immigrants | Afghanistan | 24.2 /100 | #205 | Fair 2.4% |
| Koreans | 24.1 /100 | #206 | Fair 2.4% |
| Whites/Caucasians | 22.6 /100 | #207 | Fair 2.4% |
| Immigrants | Kenya | 20.3 /100 | #208 | Fair 2.4% |
Demographics Similar to Laotians by Single Father Households
In terms of single father households, the demographic groups most similar to Laotians are Luxembourger (2.2%, a difference of 0.040%), Brazilian (2.2%, a difference of 0.090%), British (2.2%, a difference of 0.090%), Immigrants from Nepal (2.2%, a difference of 0.10%), and Slovak (2.2%, a difference of 0.44%).
| Demographics | Rating | Rank | Single Father Households |
| Zimbabweans | 95.1 /100 | #134 | Exceptional 2.2% |
| Syrians | 94.8 /100 | #135 | Exceptional 2.2% |
| Chileans | 94.5 /100 | #136 | Exceptional 2.2% |
| Austrians | 94.2 /100 | #137 | Exceptional 2.2% |
| West Indians | 94.1 /100 | #138 | Exceptional 2.2% |
| Brazilians | 92.8 /100 | #139 | Exceptional 2.2% |
| British | 92.8 /100 | #140 | Exceptional 2.2% |
| Laotians | 92.5 /100 | #141 | Exceptional 2.2% |
| Luxembourgers | 92.3 /100 | #142 | Exceptional 2.2% |
| Immigrants | Nepal | 92.1 /100 | #143 | Exceptional 2.2% |
| Slovaks | 90.7 /100 | #144 | Exceptional 2.2% |
| Immigrants | Zimbabwe | 90.2 /100 | #145 | Exceptional 2.2% |
| Northern Europeans | 89.8 /100 | #146 | Excellent 2.2% |
| Slavs | 88.9 /100 | #147 | Excellent 2.2% |
| South American Indians | 88.5 /100 | #148 | Excellent 2.3% |