Immigrants from Uganda vs Honduran Self-Care Disability
COMPARE
Immigrants from Uganda
Honduran
Self-Care Disability
Self-Care Disability Comparison
Immigrants from Uganda
Hondurans
2.3%
SELF-CARE DISABILITY
99.8/ 100
METRIC RATING
42nd/ 347
METRIC RANK
2.6%
SELF-CARE DISABILITY
3.8/ 100
METRIC RATING
221st/ 347
METRIC RANK
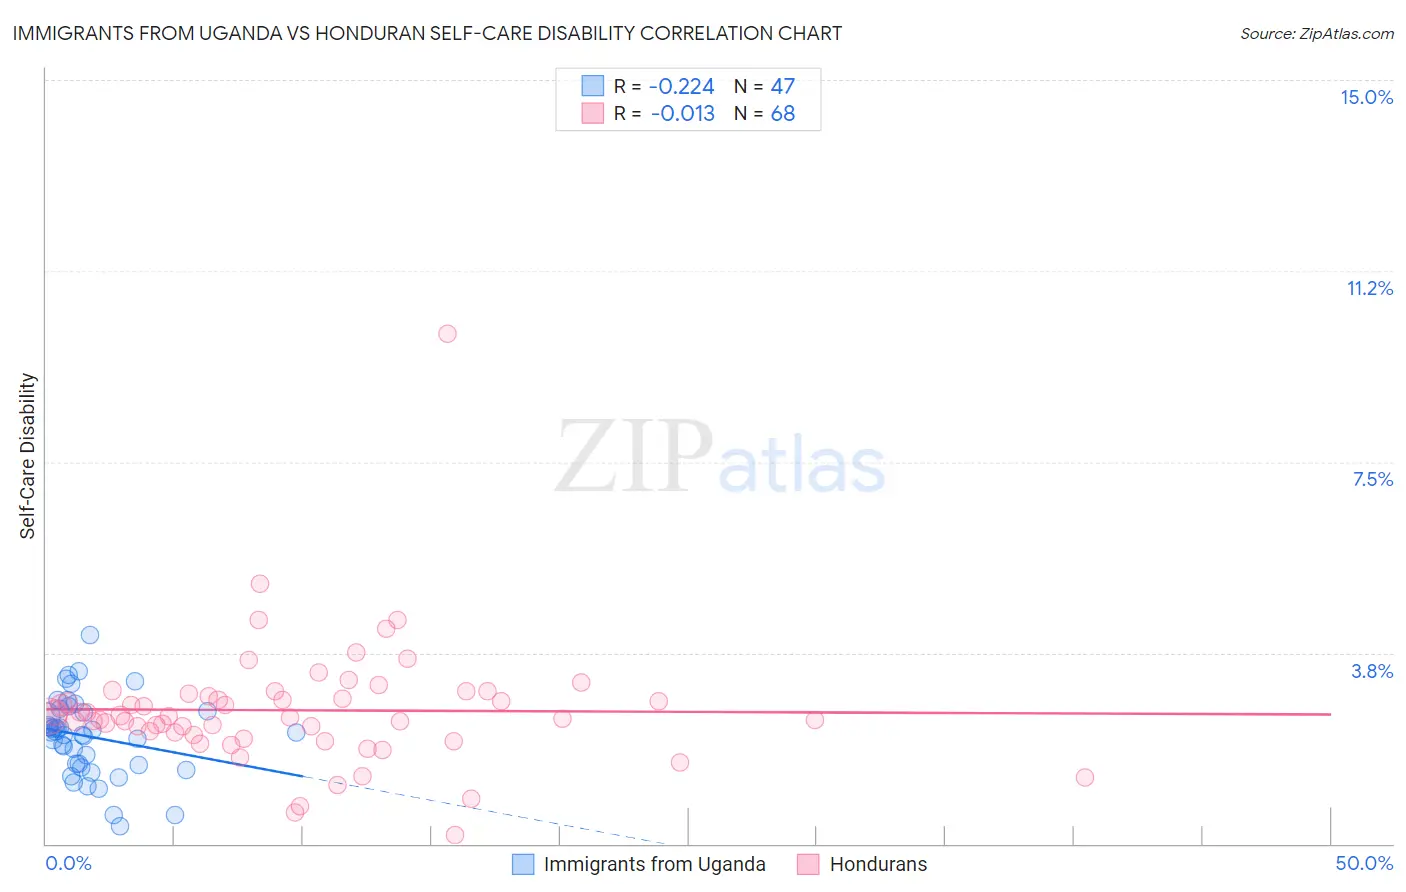
Immigrants from Uganda vs Honduran Self-Care Disability Correlation Chart
The statistical analysis conducted on geographies consisting of 125,933,706 people shows a weak negative correlation between the proportion of Immigrants from Uganda and percentage of population with self-care disability in the United States with a correlation coefficient (R) of -0.224 and weighted average of 2.3%. Similarly, the statistical analysis conducted on geographies consisting of 357,432,362 people shows no correlation between the proportion of Hondurans and percentage of population with self-care disability in the United States with a correlation coefficient (R) of -0.013 and weighted average of 2.6%, a difference of 12.3%.
Self-Care Disability Correlation Summary
| Measurement | Immigrants from Uganda | Honduran |
| Minimum | 0.33% | 0.18% |
| Maximum | 4.1% | 10.0% |
| Range | 3.8% | 9.9% |
| Mean | 2.1% | 2.6% |
| Median | 2.2% | 2.5% |
| Interquartile 25% (IQ1) | 1.6% | 2.2% |
| Interquartile 75% (IQ3) | 2.6% | 2.9% |
| Interquartile Range (IQR) | 1.1% | 0.75% |
| Standard Deviation (Sample) | 0.78% | 1.2% |
| Standard Deviation (Population) | 0.77% | 1.2% |
Similar Demographics by Self-Care Disability
Demographics Similar to Immigrants from Uganda by Self-Care Disability
In terms of self-care disability, the demographic groups most similar to Immigrants from Uganda are Immigrants from Pakistan (2.3%, a difference of 0.050%), Immigrants from South Africa (2.3%, a difference of 0.090%), Immigrants from Sudan (2.3%, a difference of 0.10%), Norwegian (2.3%, a difference of 0.13%), and Iranian (2.3%, a difference of 0.17%).
| Demographics | Rating | Rank | Self-Care Disability |
| Immigrants | Australia | 99.9 /100 | #35 | Exceptional 2.3% |
| Immigrants | Lithuania | 99.9 /100 | #36 | Exceptional 2.3% |
| Immigrants | Sweden | 99.9 /100 | #37 | Exceptional 2.3% |
| Immigrants | Eastern Africa | 99.9 /100 | #38 | Exceptional 2.3% |
| Immigrants | Bulgaria | 99.8 /100 | #39 | Exceptional 2.3% |
| Iranians | 99.8 /100 | #40 | Exceptional 2.3% |
| Immigrants | Sudan | 99.8 /100 | #41 | Exceptional 2.3% |
| Immigrants | Uganda | 99.8 /100 | #42 | Exceptional 2.3% |
| Immigrants | Pakistan | 99.8 /100 | #43 | Exceptional 2.3% |
| Immigrants | South Africa | 99.8 /100 | #44 | Exceptional 2.3% |
| Norwegians | 99.8 /100 | #45 | Exceptional 2.3% |
| Czechs | 99.8 /100 | #46 | Exceptional 2.3% |
| Jordanians | 99.7 /100 | #47 | Exceptional 2.3% |
| Immigrants | Malaysia | 99.7 /100 | #48 | Exceptional 2.3% |
| Latvians | 99.7 /100 | #49 | Exceptional 2.3% |
Demographics Similar to Hondurans by Self-Care Disability
In terms of self-care disability, the demographic groups most similar to Hondurans are Spaniard (2.6%, a difference of 0.010%), French Canadian (2.6%, a difference of 0.020%), Subsaharan African (2.6%, a difference of 0.040%), Immigrants from Moldova (2.6%, a difference of 0.050%), and Osage (2.6%, a difference of 0.070%).
| Demographics | Rating | Rank | Self-Care Disability |
| Immigrants | Honduras | 4.7 /100 | #214 | Tragic 2.6% |
| Immigrants | Thailand | 4.5 /100 | #215 | Tragic 2.6% |
| Whites/Caucasians | 4.4 /100 | #216 | Tragic 2.6% |
| Celtics | 4.4 /100 | #217 | Tragic 2.6% |
| Scotch-Irish | 4.1 /100 | #218 | Tragic 2.6% |
| Immigrants | Moldova | 4.0 /100 | #219 | Tragic 2.6% |
| Sub-Saharan Africans | 4.0 /100 | #220 | Tragic 2.6% |
| Hondurans | 3.8 /100 | #221 | Tragic 2.6% |
| Spaniards | 3.8 /100 | #222 | Tragic 2.6% |
| French Canadians | 3.8 /100 | #223 | Tragic 2.6% |
| Osage | 3.6 /100 | #224 | Tragic 2.6% |
| Iraqis | 3.2 /100 | #225 | Tragic 2.6% |
| Chinese | 2.9 /100 | #226 | Tragic 2.6% |
| Immigrants | Philippines | 2.7 /100 | #227 | Tragic 2.6% |
| Guatemalans | 2.7 /100 | #228 | Tragic 2.6% |